Medicare Improper Payment Rate by Provider Type (FY2025 CERT)
By MedPrecision Operations Team · Published
CMS measures the Medicare improper payment rate by provider type through its Comprehensive Error Rate Testing (CERT) program, and the FY2025 edition is the latest published as of 23 October 2026. The rate is a payment-accuracy measure. It counts overpayments, underpayments and payments the records did not support, and it is not a fraud rate. As of 23 October 2026, CMS published the provider-type rates only as tables inside a PDF appendix. The claim-level CERT sample behind them, which carries a provider type field, is a separate CSV on data.cms.gov. For a physician practice, the provider type is usually its medical specialty, such as cardiology or nephrology, so the table below also answers the question of the Medicare improper payment rate by specialty. We put every Part B row into one table with its 95% confidence interval, claims reviewed, projected improper payments and error-type split, then added the leading E/M codes and the national trend since 2015.
What is Medicare's improper payment rate by provider type?
In CMS's FY2025 CERT data, a payment-accuracy measure and not a fraud rate, Medicare fee-for-service paid $28.83 billion of $439.88 billion improperly (6.55%) on claims submitted July 2023 to June 2024. Part B claims ran 8.4%. Among Part B provider types, chiropractic had the highest point estimate, 30.4% (95% CI 18.7% to 42.2%).
- Part B rate: 8.4% (95% CI 7.6% to 9.3%) on 11,600 claims reviewed in FY2025.
- Six provider types sit above the Part B rate at the confidence-interval level, including chiropractic, clinical laboratories and physical therapists.
- No documentation and insufficient documentation together made up 74.1% of Part B improper payments (MedPrecision calculation from CMS Table J1).
- CPT 99215 ran 14.8%, and incorrect coding made up 72.5% of its improper payments.
- The national rate fell from 12.09% in 2015 to 6.55% in 2025.
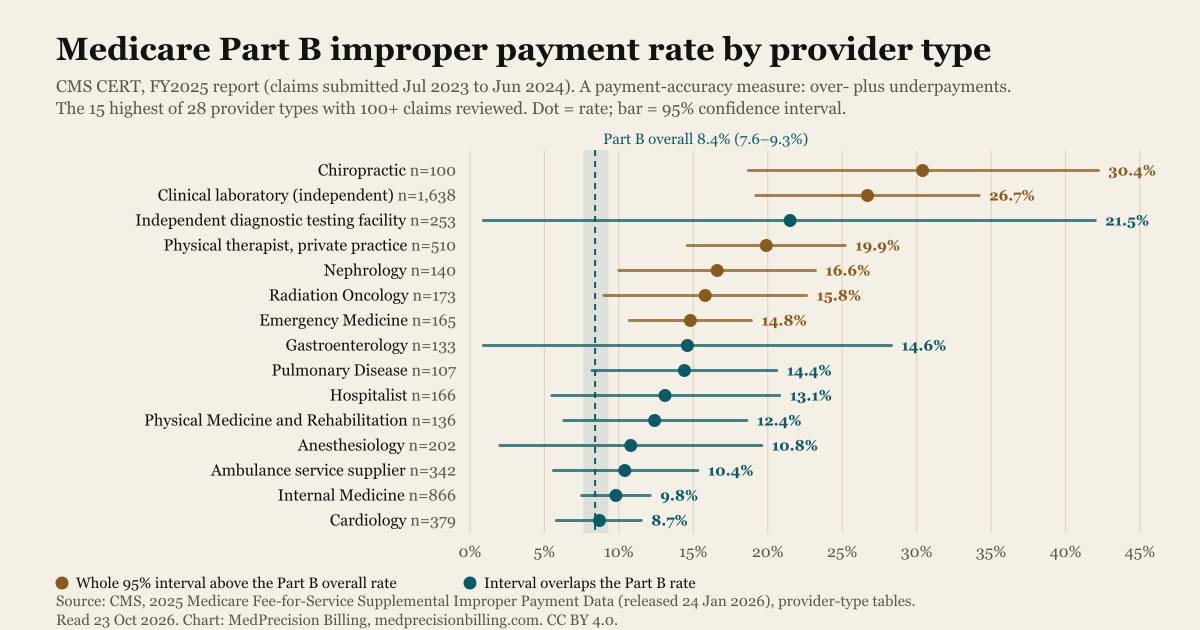
Medicare improper payment rate by provider type: the FY2025 Part B table
CMS publishes the Medicare improper payment rate by provider type for each claim type in Appendix I of its annual supplemental data (Tables I1 to I4). This page uses Table I1, Part B, the claim type physician practices bill. Most Part B provider types are medical specialties, so a practice can read its specialty's row directly. The FY2025 table covers claims submitted July 2023 to June 2024, and CMS released it on 24 January 2026.
Finding: In FY2025, Medicare Part B claims had an improper payment rate of 8.4% (95% CI 7.6% to 9.3%) across 11,600 claims reviewed (CMS CERT, Table I1, read 23 October 2026).
Finding: Chiropractic had the highest Part B point estimate in FY2025, 30.4% (95% CI 18.7% to 42.2%) on 100 claims reviewed, and insufficient documentation made up 89.5% of its improper payments (CMS CERT, Tables I1 and J1).
How to read each column:
- Improper payment rate is the provider type's projected improper payments as a share of its Medicare payments, estimated from the CERT sample.
- 95% CI is the confidence interval CMS prints around that estimate. A lower bound in parentheses, such as (0.1%), is negative as printed.
- Claims reviewed is the number of claims of that provider type that CERT reviewed. A wide interval means a less certain estimate. Fewer claims tend to give a wider interval, though not always: IDTF had 253 claims reviewed and an interval of 0.9% to 42.0%.
- Projected improper payments is CMS's national dollar projection for the provider type, not the dollars inside the sample.
- The five error columns split each provider type's improper payments by error category (Table J1). CMS printed no split for Centralized Flu or Mass Immunization Roster Billers, which had no improper payments.
The table is sorted by rate, with the Part B overall row pinned first.
| Provider type | Improper payment rate | 95% CI | Claims reviewed | Projected improper payments | No documentation | Insufficient documentation | Medical necessity | Incorrect coding | Other |
|---|---|---|---|---|---|---|---|---|---|
| Overall, all Part B claims (CMS label: "Incl. Codes Not Listed") | 8.4% | 7.6% to 9.3% | 11,600 | $9,624,572,895 | 15.7% | 58.4% | 1.6% | 18.8% | 5.5% |
| Chiropractic | 30.4% | 18.7% to 42.2% | 100 | $144,031,007 | 6.0% | 89.5% | 3.0% | 1.5% | 0.0% |
| Clinical Laboratory (Billing Independently) | 26.7% | 19.2% to 34.2% | 1,638 | $1,421,143,632 | 19.4% | 77.0% | 0.8% | 0.6% | 2.1% |
| Independent Diagnostic Testing Facility (IDTF) | 21.5% | 0.9% to 42.0% | 253 | $200,118,305 | 71.0% | 27.0% | 0.0% | 0.0% | 1.9% |
| Physical Therapist in Private Practice | 19.9% | 14.6% to 25.2% | 510 | $731,760,479 | 2.9% | 88.3% | 0.0% | 0.0% | 8.8% |
| Cardiac Electrophysiology | 18.1% | 3.8% to 32.5% | 46 | $65,916,057 | 41.4% | 42.7% | 0.0% | 15.9% | 0.0% |
| Nephrology | 16.6% | 10.0% to 23.2% | 140 | $212,471,664 | 14.4% | 51.8% | 0.0% | 23.2% | 10.7% |
| Critical Care (Intensivists) | 16.1% | 5.0% to 27.2% | 34 | $35,838,802 | 0.0% | 48.0% | 0.0% | 39.9% | 12.1% |
| Radiation Oncology | 15.8% | 9.0% to 22.6% | 173 | $226,228,587 | 9.3% | 87.9% | 0.0% | 2.3% | 0.5% |
| Portable X-Ray Supplier (Billing Independently) | 15.2% | 4.8% to 25.6% | 75 | $40,065,658 | 6.0% | 87.6% | 0.0% | 0.0% | 6.4% |
| Emergency Medicine | 14.8% | 10.7% to 18.9% | 165 | $278,578,295 | 15.0% | 15.2% | 0.0% | 69.8% | 0.0% |
| Gastroenterology | 14.6% | 0.9% to 28.3% | 133 | $178,420,590 | 66.3% | 24.9% | 0.0% | 8.6% | 0.2% |
| Pulmonary Disease | 14.4% | 8.2% to 20.6% | 107 | $178,790,919 | 8.9% | 27.7% | 0.0% | 47.3% | 16.1% |
| Unknown Provider Type | 13.4% | 4.9% to 21.9% | 102 | $68,179,750 | 9.8% | 87.0% | 0.0% | 0.1% | 3.1% |
| Psychiatry | 13.3% | 5.2% to 21.5% | 60 | $97,257,705 | 6.6% | 40.6% | 0.0% | 52.8% | 0.0% |
| Hospitalist | 13.1% | 5.5% to 20.8% | 166 | $141,000,892 | 12.5% | 4.4% | 0.0% | 49.3% | 33.8% |
| Occupational Therapist in Private Practice | 12.8% | 2.5% to 23.2% | 45 | $54,110,911 | 32.6% | 47.9% | 0.0% | 0.0% | 19.6% |
| Physical Medicine and Rehabilitation | 12.4% | 6.3% to 18.6% | 136 | $120,990,931 | 8.1% | 53.8% | 0.0% | 37.5% | 0.6% |
| All Provider Types With Less Than 30 Claims | 10.8% | 6.3% to 15.3% | 664 | $695,663,017 | 10.4% | 59.7% | 0.6% | 20.7% | 8.7% |
| Anesthesiology | 10.8% | 2.0% to 19.6% | 202 | $147,680,721 | 27.4% | 68.7% | 0.0% | 3.8% | 0.1% |
| Ambulance Service Supplier (e.g., private ambulance companies) | 10.4% | 5.6% to 15.3% | 342 | $452,598,022 | 11.5% | 46.7% | 24.9% | 0.3% | 16.6% |
| Internal Medicine | 9.8% | 7.5% to 12.1% | 866 | $773,434,434 | 16.0% | 46.1% | 0.3% | 32.9% | 4.6% |
| Pathology | 8.9% | 2.6% to 15.2% | 94 | $79,860,881 | 13.5% | 86.3% | 0.0% | 0.0% | 0.3% |
| Cardiology | 8.7% | 5.8% to 11.5% | 379 | $321,213,865 | 8.1% | 57.9% | 0.0% | 30.3% | 3.8% |
| Urology | 8.4% | 2.3% to 14.6% | 85 | $88,264,058 | 23.9% | 52.5% | 0.0% | 16.3% | 7.3% |
| Certified Registered Nurse Anesthetist (CRNA) | 8.3% | 1.6% to 15.0% | 85 | $58,766,845 | 85.8% | 14.2% | 0.0% | 0.0% | 0.0% |
| Clinical Psychologist | 8.2% | (0.1%) to 16.4% | 65 | $45,406,287 | 0.0% | 86.2% | 0.0% | 13.8% | 0.0% |
| Neurology | 7.8% | 3.4% to 12.1% | 130 | $99,438,247 | 23.2% | 20.4% | 1.1% | 54.4% | 0.9% |
| Family Practice | 7.6% | 4.3% to 11.0% | 509 | $416,972,278 | 10.7% | 68.1% | 0.3% | 17.5% | 3.4% |
| Nurse Practitioner | 7.2% | 5.3% to 9.2% | 835 | $476,720,264 | 12.0% | 42.9% | 2.2% | 38.9% | 4.0% |
| Interventional Cardiology | 6.7% | 1.9% to 11.5% | 92 | $65,008,140 | 0.0% | 38.9% | 0.0% | 50.9% | 10.2% |
| Orthopedic Surgery | 6.3% | 0.9% to 11.8% | 147 | $188,626,782 | 13.4% | 62.3% | 0.0% | 24.2% | 0.0% |
| Clinical Social Worker | 6.3% | 0.7% to 12.0% | 68 | $24,638,769 | 42.6% | 49.6% | 0.0% | 7.7% | 0.0% |
| Diagnostic Radiology | 5.8% | 3.3% to 8.3% | 564 | $260,830,181 | 23.3% | 76.6% | 0.1% | 0.0% | 0.0% |
| Endocrinology | 5.5% | 0.0% to 11.0% | 50 | $23,153,862 | 35.5% | 18.4% | 0.0% | 46.1% | 0.0% |
| Podiatry | 5.1% | 0.6% to 9.7% | 170 | $147,685,729 | 1.7% | 65.2% | 0.0% | 21.3% | 11.8% |
| Infectious Disease | 4.0% | (0.0%) to 8.1% | 60 | $30,210,351 | 18.0% | 0.0% | 0.0% | 82.0% | 0.0% |
| Ambulatory Surgical Center | 3.7% | 1.7% to 5.7% | 331 | $241,912,063 | 4.3% | 70.9% | 0.0% | 3.3% | 21.4% |
| General Surgery | 3.6% | 0.5% to 6.7% | 93 | $74,238,495 | 21.1% | 39.1% | 0.0% | 39.8% | 0.0% |
| Dermatology | 3.4% | 0.9% to 5.8% | 202 | $103,438,232 | 26.2% | 34.2% | 0.0% | 39.6% | 0.0% |
| Ophthalmology | 3.2% | 0.2% to 6.3% | 507 | $253,124,779 | 0.0% | 67.7% | 0.0% | 31.2% | 1.1% |
| Physician Assistant | 3.2% | 0.8% to 5.5% | 304 | $168,069,844 | 13.2% | 50.0% | 0.7% | 34.3% | 1.7% |
| Optometry | 2.3% | 0.2% to 4.4% | 116 | $27,292,221 | 0.0% | 60.1% | 0.0% | 39.9% | 0.0% |
| Hematology/Oncology | 1.7% | 0.2% to 3.2% | 292 | $113,720,869 | 29.2% | 37.6% | 0.8% | 31.2% | 1.2% |
| Rheumatology | 1.6% | 0.5% to 2.8% | 276 | $46,043,608 | 19.7% | 50.1% | 0.0% | 19.4% | 10.9% |
| Medical Oncology | 0.6% | (0.1%) to 1.3% | 58 | $5,655,870 | 0.0% | 0.2% | 0.0% | 78.1% | 21.7% |
| Centralized Flu | 0.0% | 0.0% to 0.0% | 54 | $0 | – | – | – | – | – |
| Mass Immunization Roster Billers | 0.0% | 0.0% to 0.0% | 83 | $0 | – | – | – | – | – |
What the CERT rate measures, and what it does not
CERT reviews a statistically valid stratified random sample of Medicare fee-for-service claims to decide whether each one was paid properly under Medicare coverage, coding and payment rules. The result is a payment-accuracy measure: for FY2025, CMS reports a 93.45% accuracy rate next to the 6.55% improper payment rate.
Part B is one of several claim types CMS measures, and each one carries its own rate. CMS also prints a provider-type table for each of the other claim types (Tables I2 to I4); this page covers Part B only.
| Claim type (FY2025, Table A1) | Improper payment rate | 95% CI | Claims reviewed |
|---|---|---|---|
| Part B (all provider types) | 8.4% | 7.6% to 9.3% | 11,600 |
| DMEPOS | 24.1% | 16.7% to 31.6% | 8,650 |
| Part A excluding Hospital IPPS | 6.7% | 5.5% to 7.8% | 8,651 |
| Part A Hospital IPPS (adjusted) | 3.1% | 2.8% to 3.5% | 8,750 |
| Part A total (adjusted) | 5.4% | 4.6% to 6.1% | 17,401 |
"Improper" runs in both directions. It counts overpayments and underpayments, and it counts payments where the records did not support the service billed.
Finding: In FY2025, Medicare FFS overpayments came to $27.9 billion and underpayments to $1.0 billion across all claim types (CMS CERT, Table A4).
In Part B alone, overpayments were $9.3 billion and underpayments $0.3 billion. CMS's CERT guidance, "Assignment of Error Categories" (January 2016), places each improper payment in one of five error categories:
- No documentation: the provider did not respond to repeated requests for the medical records, or responded that it did not have them.
- Insufficient documentation: the records sent were not enough to support payment, so reviewers could not conclude the service was provided, provided at the level billed or medically necessary. A missing required element, such as a physician signature on an order, also falls here.
- Medical necessity: reviewers had adequate records and found the services billed were not medically necessary under Medicare coverage and payment policies.
- Incorrect coding: the records support a different code than the one billed, show that someone other than the billing provider performed the service, show the service was unbundled, or show a discharge to a site other than the one coded.
- Other: errors that fit none of the four categories above, such as a duplicate payment or a non-covered service.
The rate is not a fraud rate. For its report, CMS counts every payment that CERT did not flag as correct, and it notes that fraud the review did not discern could still be present. A high rate for your provider type says nothing about intent.
The CERT rate also cannot be compared with your practice's claim denial rate. A claim denial rate is a different measure: it counts the claims or dollars a payer refuses, and published rates use different denominators. Our page on how denial rates are measured by specialty found no current specialty denial rate that states its denominator and sample. CERT reviews a sample of Medicare claims and tests whether the payment itself was right.
Which provider types sit above or below the 8.4% Part B rate
The provider-type rates are estimates from a sample, so the confidence interval matters more than the ranking. We compared each provider type's 95% interval with the Part B rate of 8.4%. This is a comparison against a point estimate, not a formal significance test.
Finding: In FY2025 CERT data, six Part B provider types had a 95% confidence interval entirely above the Part B rate of 8.4% (MedPrecision calculation from CMS Table I1).
- Chiropractic: 30.4% (18.7% to 42.2%), 100 claims reviewed.
- Clinical laboratory billing independently: 26.7% (19.2% to 34.2%), 1,638 claims reviewed.
- Physical therapist in private practice: 19.9% (14.6% to 25.2%), 510 claims reviewed.
- Nephrology: 16.6% (10.0% to 23.2%), 140 claims reviewed.
- Radiation oncology: 15.8% (9.0% to 22.6%), 173 claims reviewed.
- Emergency medicine: 14.8% (10.7% to 18.9%), 165 claims reviewed.
Chiropractic and physical therapy both sit above the Part B rate, and both trace to documentation rather than coding. If you bill for either, our pages on chiropractic billing services and physical therapy billing cover how those claims are prepared.
Finding: In FY2025 CERT data, among provider types with any improper payments, 11 Part B provider types had a 95% confidence interval entirely below 8.4% (MedPrecision calculation from CMS Table I1).
Those 11 are diagnostic radiology, ophthalmology, ambulatory surgical centers, physician assistants, hematology/oncology, dermatology, general surgery, rheumatology, infectious disease, optometry and medical oncology. Two more rows, Centralized Flu and Mass Immunization Roster Billers, had no improper payments (0.0%, interval 0.0% to 0.0%), which makes 13 rows below 8.4% in all.
Every remaining row has an interval that includes 8.4%. For those rows, the data cannot say whether the provider type differs from Part B as a whole. Internal medicine, the overlapping row with the most claims reviewed, ran 9.8% (7.5% to 12.1%) on 866 claims reviewed, with $773,434,434 in projected improper payments. Cardiology ran 8.7% (5.8% to 11.5%), family practice 7.6% (4.3% to 11.0%) and nurse practitioners 7.2% (5.3% to 9.2%). Practices that bill as internal medicine can compare this row with our page on internal medicine billing.
Seven provider types have an interval 20 percentage points wide or wider, including IDTF (0.9% to 42.0%, 253 claims reviewed) and gastroenterology (0.9% to 28.3%, 133 claims reviewed). Three of those seven also rest on few claims: critical care (intensivists) had 34 claims reviewed, occupational therapists in private practice 45 and cardiac electrophysiology 46. Treat all seven rates as rough.
Documentation or coding: what drives each provider type's errors
The error split tells you where a provider type's improper payments come from. Nationally, documentation problems outweigh every other cause.
Finding: In FY2025, insufficient documentation made up 53.0% of national Medicare FFS improper payments, and no documentation another 12.0% (CMS CERT, Table A3).
Together, documentation errors made up 65.0% of national improper payments (MedPrecision calculation: 12.0% + 53.0%). Medical necessity made up 15.3%, incorrect coding 11.1% and other errors 8.5%.
Finding: In FY2025, no documentation and insufficient documentation together made up 74.1% of Part B improper payments (MedPrecision calculation: 15.7% + 58.4%, CMS Table J1).
The split differs sharply by provider type. Examples, grouped by the error category with the largest share in Table J1:
- Insufficient documentation leads: chiropractic 89.5%, physical therapist in private practice 88.3%, radiation oncology 87.9%, portable X-ray supplier 87.6%, pathology 86.3%, clinical psychologist 86.2%, clinical laboratory 77.0% and diagnostic radiology 76.6%.
- Incorrect coding leads: infectious disease 82.0%, medical oncology 78.1%, emergency medicine 69.8%, neurology 54.4%, psychiatry 52.8%, interventional cardiology 50.9%, hospitalist 49.3% and pulmonary disease 47.3%.
- No documentation leads: certified registered nurse anesthetists 85.8%, IDTF 71.0% and gastroenterology 66.3%.
- Medical necessity is a small share in most rows. Ambulance service suppliers are the exception, at 24.9%.
Some rows mix causes. Internal medicine splits 46.1% insufficient documentation and 32.9% incorrect coding, and nurse practitioners 42.9% and 38.9%.
When documentation leads your row, the fix sits in the record before the claim goes out. That is the work of clinical documentation improvement services: checking that each note, order and signature supports the service billed.
E/M visits: where office and hospital visit errors concentrate
Evaluation and management (E/M) visits get their own table in the CERT data, Table K1. It reports a rate, an interval, projected dollars and the error split for the E/M codes with the most projected improper payments, plus a pooled row for codes with fewer than 30 claims, but no count of claims reviewed.
Finding: In FY2025, E/M services had an improper payment rate of 10.1% (95% CI 9.0% to 11.1%), and incorrect coding made up 50.0% of E/M improper payments (CMS CERT, Table K1).
Finding: In FY2025, CPT 99215 had an improper payment rate of 14.8% (95% CI 11.6% to 18.1%), and incorrect coding made up 72.5% of its improper payments (CMS CERT, Table K1).
A low rate can still carry large dollars. CPT 99214 ran 5.0%, yet it carried $459,838,842 in projected improper payments. CPT 99213 ran 2.1%, and incorrect coding made up 88.4% of its improper payments. The high-complexity hospital follow-up visit, 99233, ran 22.7% with $502,418,067 projected.
Both chronic care management codes sit apart. CPT 99490 ran 65.2% (53.4% to 77.0%), and insufficient documentation made up 87.7% of its improper payments. CPT 99491, the code for the first 30 minutes of physician time, ran 75.4% (68.7% to 82.2%), with insufficient documentation at 92.5%, on a smaller $11,676,724 projected. Our guide to chronic care management billing with 99490 covers the consent and time records those claims depend on. CPT 99211 ran 37.1%, with a wide interval of 21.5% to 52.7%.
The table shows the overall E/M row and six selected codes, sorted by projected improper payments, the order CMS uses.
| CPT code | Service (plain English) | Improper payment rate | 95% CI | Projected improper payments | No documentation | Insufficient documentation | Medical necessity | Incorrect coding | Other |
|---|---|---|---|---|---|---|---|---|---|
| All E/M codes | Overall E/M | 10.1% | 9.0% to 11.1% | $3,265,045,695 | 12.6% | 31.1% | 0.0% | 50.0% | 6.3% |
| 99233 | Hospital inpatient or observation follow-up visit, high complexity | 22.7% | 18.7% to 26.7% | $502,418,067 | 9.4% | 17.1% | 0.0% | 57.7% | 15.9% |
| 99214 | Established-patient office visit, moderate complexity | 5.0% | 3.3% to 6.6% | $459,838,842 | 20.7% | 16.7% | 0.0% | 62.5% | 0.0% |
| 99215 | Established-patient office visit, high complexity | 14.8% | 11.6% to 18.1% | $245,231,199 | 21.9% | 5.6% | 0.0% | 72.5% | 0.0% |
| 99490 | Chronic care management, clinical staff time, first monthly block | 65.2% | 53.4% to 77.0% | $205,392,699 | 12.3% | 87.7% | 0.0% | 0.0% | 0.0% |
| 99213 | Established-patient office visit, low complexity | 2.1% | 0.2% to 4.1% | $101,291,185 | 4.5% | 7.1% | 0.0% | 88.4% | 0.0% |
| 99211 | Established-patient office visit, minimal level | 37.1% | 21.5% to 52.7% | $8,911,824 | 22.4% | 65.1% | 0.0% | 12.5% | 0.0% |
When coding drives your E/M row, a medical coding audit compares the level billed with the level the note supports, visit by visit.
The ten-year Medicare FFS improper payment rate trend
CMS publishes a national Medicare FFS rate for every reporting year. Each reporting year covers claims submitted from July two years earlier through June of the prior year.
Finding: The national Medicare FFS improper payment rate fell from 12.09% in reporting year 2015 to 6.55% in 2025, 5.54 percentage points lower (MedPrecision calculation from the CMS trend table).
From 2024 to 2025 the rate fell 1.11 percentage points, from 7.66% (7.2% to 8.1%) to 6.55% (5.9% to 7.2%). The two intervals touch at 7.2%, so read the one-year change with care.
CMS adjusts the national rate for Part A to B rebilling of inpatient hospital claims. For FY2025, the adjustment lowered the rate 0.20 percentage points ($878.94 million), from 6.75% to 6.55%. The trend figures below are the adjusted national rates.
| Reporting year | Improper payment rate | 95% CI | Total expenditures ($ billions) | Projected improper payments ($ billions) |
|---|---|---|---|---|
| 2015 | 12.09% | 11.4% to 12.7% | 358.35 | 43.33 |
| 2016 | 11.00% | 10.2% to 11.8% | 373.65 | 41.08 |
| 2017 | 9.51% | 8.9% to 10.1% | 380.76 | 36.21 |
| 2018 | 8.12% | 7.6% to 8.6% | 389.30 | 31.62 |
| 2019 | 7.25% | 6.9% to 7.6% | 398.62 | 28.91 |
| 2020 | 6.27% | 5.8% to 6.7% | 410.81 | 25.74 |
| 2021 | 6.26% | 5.8% to 6.7% | 399.78 | 25.03 |
| 2022 | 7.46% | 6.9% to 8.0% | 421.91 | 31.46 |
| 2023 | 7.38% | 6.8% to 7.9% | 423.01 | 31.23 |
| 2024 | 7.66% | 7.2% to 8.1% | 413.72 | 31.70 |
| 2025 | 6.55% | 5.9% to 7.2% | 439.88 | 28.83 |
What to do with your provider type's row
Your provider type's row is a national estimate. It does not predict the outcome of any audit of your own claims, but it does tell you where Medicare reviewers find errors in claims like yours.
- Find your row and read the interval first. If it includes the Part B rate of 8.4%, the data cannot set your provider type apart from Part B as a whole.
- Read the largest error column. It tells you whether to start with the record, the code or the medical-necessity support.
- Answer every CERT documentation request on time. CERT asks for records within 45 calendar days of the request and may grant an extension. A claim with no records sent can fall in the no-documentation category.
- Where documentation leads, check the record before billing. Confirm signatures, orders and the note's support for each billed service.
- Where coding leads, run an E/M level review. Compare the level billed with what the note supports, on a sample of recent visits.
- Work from a written checklist. Our medical billing audit checklist lists the documentation and coding items to test.
- Recheck your row when the FY2026 data appears. CMS posts the provider-type detail some time after HHS publishes the national rate each November.
How we built this: methodology, limitations and read date
Read date: every figure on this page was read from CMS on 23 October 2026. FY2025 is the latest published CERT data as of that date.
Sources:
- CMS, 2025 Medicare Fee-for-Service Supplemental Improper Payment Data (PDF), Tables A1, A3, A4, B8, I1, I2, J1 and K1, released 24 January 2026.
- CMS, Comprehensive Error Rate Testing (CERT) program page, for the national rate, the sampling method and the documentation-request window.
- CMS, Improper Payment Rates and Additional Data, for the 2015 to 2025 trend.
- CMS, CERT Reports list, for the release date and the claims period.
- CMS, CERT "Assignment of Error Categories" (January 2016), for the five error-category definitions (PDF)
- CMS, Medicare Fee-for-Service Comprehensive Error Rate Testing dataset on data.cms.gov: the claim-level CERT sample with provider type, type of bill, review decision and error code, as CSV and API; the 2025 entry was last modified 3 February 2026. data.cms.gov refused our requests, so we read its catalog from the archive capture web.archive.org/web/20261020232131/https://data.cms.gov/data.json. We did not use the claim-level file; every rate on this page is CMS's own tabulation.
How we built this:
- We transcribed every provider-type row of Tables I1 and J1, the E/M rows of Table K1 and the trend table into one CSV, one row per data point. Each figure carries the CMS source URL and the date we read it.
- We did not round or change any CMS figure. Every figure labelled "MedPrecision calculation" states its inputs and formula.
- The sample frame is claims submitted 1 July 2023 to 30 June 2024. CERT sampled 49,061 claims across all claim types and reviewed 37,651; Part B accounts for 11,920 sampled and 11,600 reviewed.
- The confidence intervals are the 95% intervals CMS printed. A lower bound in parentheses is negative as printed.
Limitations:
- Adjusted and unadjusted totals differ. The share-of-national column in Table I1 is a share of the unadjusted national total of $29,705.5 million (6.8% as printed in Table B8, the state table; 6.75% to two decimals, as CMS states the unadjusted rate). Table A1 shows Part B at 33.4% of the adjusted total. Our check: $9,624,572,895 divided by $29,705.5 million is 32.4% (MedPrecision calculation), which matches the Part B share printed in I1. We left that column out of the table above so the two bases are not mixed; it is in the CSV.
- Pooled rows. "All Provider Types With Less Than 30 Claims" pools the provider types too small to list, and "Unknown Provider Type" holds claims without one.
- No claim counts for E/M. Table K1 prints no claims-reviewed count, so you cannot judge an E/M code's sample size from it.
- Scope. These are Medicare fee-for-service figures only. They exclude Medicare Advantage, Part D and Medicaid, and they are not a fraud rate or a claim denial rate.
- Point estimates against intervals. The above and below lists compare each interval with the Part B point estimate, not a formal significance test. The count of 11 rows below 8.4% excludes the two immunization biller rows with no improper payments; including them, 13 rows sit below.
Refresh: each November, HHS publishes the improper payment rate in its Agency Financial Report, and CMS publishes the detail later. The FY2025 detail followed on 24 January 2026. This page will be updated when the FY2026 provider-type tables appear.
Coverage check: in a search on 23 October 2026, we found no billing-company page that publishes the FY2025 Part B provider-type table with confidence intervals. We searched Google for the FY2025 provider-type figures and checked the pages that ranked for the provider-type and specialty queries. As of 23 October 2026, CMS's report page offers the provider-type rates only in the PDF appendix; the claim-level sample on data.cms.gov is described as claim-level records (provider type, review decision, error code). The American Chiropractic Association has reported the 2025 chiropractic rate on its own site, without the confidence interval or the chiropractic error split.
Free Billing Screening · No obligation
Find the Error Type Behind Your Own Medicare Claims
Tell us your provider type and how you bill Medicare, and talk with our team about where documentation or coding gaps would show up in your claims.
Prefer to talk? Book a 15-minute callA free screening reviews a permitted 12-month practice-management export and provides a short written memo within five business days after receipt. It includes no chart review, coding opinion or extrapolated recovery figure. Chart-based audits are separately scoped and quoted.
Request received
A billing specialist will review your practice details and reach out within 1 business day. A confirmation email may also arrive. If it does not, you can reach us at +1-872-297-2815.
Cite this data
Licensed under CC BY 4.0: free to reuse with attribution to MedPrecision Billing, including the charts and the underlying dataset. Figures were verified against their primary sources on .
Citation line
Source: Medicare Improper Payment Rate by Provider Type, MedPrecision Billing. https://www.medprecisionbilling.com/resources/medicare-improper-payment-rate-by-provider-type/ Embed the chart
<a href="https://www.medprecisionbilling.com/resources/medicare-improper-payment-rate-by-provider-type/"><img src="https://www.medprecisionbilling.com/images/og/resources/medicare-improper-payment-rate-by-provider-type.png" alt="Dot chart of CMS CERT FY2025 Medicare Part B improper payment rates, with 95% confidence intervals, for the 15 highest of 28 provider types with 100 or more claims reviewed. Chiropractic (30.4%), clinical laboratories billing independently (26.7%) and independent diagnostic testing facilities (21.5%) have the highest point estimates, against a Part B overall rate of 8.4% (95% interval 7.6% to 9.3%). These are payment-accuracy rates covering over- and underpayments." width="1200" height="630" style="max-width:100%;height:auto"></a>
<p>Source: <a href="https://www.medprecisionbilling.com/resources/medicare-improper-payment-rate-by-provider-type/">Medicare Improper Payment Rate by Provider Type</a> — MedPrecision Billing</p> Download the dataset
CSV — every row with its own source URLCommon Questions
Common questions about medicare improper payment rate by provider type: fy2025 cert data.
Get a Free Billing Screening
Our billing specialists can walk you through this and more.
Request a Free ScreeningWhat is the Medicare improper payment rate for FY2025?
CMS measures the FY2025 Medicare fee-for-service improper payment rate at 6.55%, with a 95% confidence interval of 5.9% to 7.2%. That represents $28.83 billion of $439.88 billion in payments. The rate covers claims submitted July 2023 to June 2024, and it is the latest published as of 23 October 2026.
Which Part B provider type has the highest Medicare improper payment rate?
CMS reports the rate by provider type, which for most physician practices is the medical specialty. In FY2025 Part B data, chiropractic had the highest point estimate at 30.4%, with a 95% confidence interval of 18.7% to 42.2%. Its interval overlaps clinical laboratories billing independently (26.7%, 19.2% to 34.2%), so the ranking between the two is not settled. Six provider types sit above the Part B rate of 8.4% at the interval level. Other claim types have their own provider-type tables, and some rows there run higher: in DMEPOS (Table I2), medical supply companies with certified orthotic personnel ran 72.5% (54.9% to 90.1%) on 185 claims reviewed.
What is the most common cause of Medicare fee-for-service improper payments?
Insufficient documentation. In FY2025 it made up 53.0% of national Medicare FFS improper payments, and no documentation made up another 12.0% (CMS CERT, Table A3). Medical necessity made up 15.3%, incorrect coding 11.1% and other errors 8.5%.
Is the CERT improper payment rate a fraud rate?
No. CMS uses CERT to measure payment accuracy: it counts overpayments, underpayments and payments the records did not support. For its report, CMS counts every payment CERT did not flag as correct, and it notes that fraud the review did not discern could still be present. In FY2025, documentation errors made up 65.0% of national improper payments (MedPrecision calculation from CMS Table A3).
Is the improper payment rate the same as a claim denial rate?
No. A claim denial rate measures the claims or dollars a payer refuses, and published rates use varying denominators. CERT reviews a sample of Medicare fee-for-service claims and tests whether each payment was right. The two measures use different claims and different tests, so you cannot compare them.
How long do I have to answer a CERT documentation request?
CERT documentation requests ask for records within 45 calendar days of the request, and the CERT program may grant extensions to providers who need more time. A claim with no records sent can fall in the no-documentation error category.
When will the FY2026 CERT data by provider type be published?
Each November, HHS publishes the national improper payment rate in its Agency Financial Report, and CMS publishes the detailed supplemental data later. The FY2025 detail appeared on 24 January 2026. On 23 October 2026, CMS's CERT Reports page listed no FY2026 report.
Related Services
Related Specialties
Find the Error Type Behind Your Own Medicare Claims
Tell us your provider type and how you bill Medicare, and talk with our team about where documentation or coding gaps would show up in your claims.
A free screening reviews a permitted 12-month practice-management export and provides a short written memo within five business days after receipt. It includes no chart review, coding opinion or extrapolated recovery figure. Chart-based audits are separately scoped and quoted.
- No obligation to continue
- Practice details only
- Reply within 1 business day