Medicare Physician Fee Schedule Conversion Factor
By MedPrecision Operations Team · Published
The conversion factor is the dollar multiplier that turns relative value units into an actual Medicare payment, and it is the single number that moves every physician's Medicare revenue at once. This tracker holds the CY2020-CY2027 history in one place, separates what CMS finalized in each rule from what Congress actually left in effect, carries the CY2026 estimated payment impact by specialty from the final rule's own impact table, and adds what the CY2027 proposed rule would do to the conversion factor and to individual codes. Every figure is traced to a CMS fact sheet or the Federal Register rule text, with the citation next to it.
What Is the Medicare Conversion Factor for 2026 — and What Does CY2027 Propose?
For CY2026 there are two conversion factors for the first time. Clinicians who are qualifying alternative payment model participants are paid on a conversion factor of $33.57, an increase of $1.22 (3.77%) over CY2025. Everyone else is paid on $33.40, an increase of $1.05 (3.26%). For CY2027, CMS proposes $33.17 and $32.84 — decreases of $0.40 (-1.19%) and $0.56 (-1.68%) — because the one-year 2.50% statutory increase that applies to CY2026 expires. Those CY2027 figures are a proposal, not a final rate: comments close September 14, 2026, and Congress has changed the conversion factor actually in effect in four of the last six years.
- CY2026 qualifying APM conversion factor: $33.57 (+3.77%)
- CY2026 nonqualifying conversion factor: $33.40 (+3.26%)
- CY2027 PROPOSED: $33.17 (-1.19%) and $32.84 (-1.68%)
- CY2027 comment period closes September 14, 2026
- A -2.5% efficiency adjustment applies to work RVUs
What the Conversion Factor Is, and Why One Number Moves Every Claim
The conversion factor converts relative value units into dollars. Medicare prices a service by adding its three geographically adjusted RVU components and multiplying the total by the conversion factor:
Payment = (Work RVU x Work GPCI + Practice Expense RVU x PE GPCI + Malpractice RVU x MP GPCI) x Conversion Factor
Because the conversion factor sits outside the parentheses, it scales every service a practice bills to Medicare simultaneously. A 2.83% cut to the conversion factor is a 2.83% cut to the Medicare line of a cardiology practice, a physical therapy clinic, and a pediatric group alike, before any RVU redistribution is considered.
Two distinctions matter when reading any conversion factor figure, and most published summaries collapse them:
- The rule value versus the in-effect value. CMS publishes a conversion factor in each year's final rule, typically in early November. In four of the last six years, Congress then changed it before or during the payment year. The number in the rule and the number that actually paid claims are frequently not the same.
- The two-decimal value versus the four-decimal value. CMS fact sheets print $33.57; the Federal Register regulatory impact analysis prints 33.5675. Contract and fee-schedule modelling should use the four-decimal figure.
Medicare Conversion Factor History, CY2020-CY2027
The table separates the two values described above. Where Congress did not legislate an in-year change, the two are identical.
| Year | As finalized in the CMS rule | In effect after legislation | What changed it |
|---|---|---|---|
| CY2020 | $36.09 | $36.09 | No in-year change |
| CY2021 | $32.41 | $34.89 | Consolidated Appropriations Act, 2021 added 3.75% |
| CY2022 | $33.59 | $34.61 | Protecting Medicare and American Farmers from Sequester Cuts Act added 3.0% |
| CY2023 | $33.06 | $33.89 | Consolidated Appropriations Act, 2023 |
| CY2024 | $32.74 | $32.74 (Jan 1-Mar 8), then $33.29 (Mar 9-Dec 31) | Consolidated Appropriations Act, 2024, mid-year |
| CY2025 | $32.35 | $32.35 | No in-year change |
| CY2026 | $33.40 nonqualifying / $33.57 qualifying APM | Same | Two conversion factors begin |
| CY2027 | Proposed $32.84 nonqualifying / $33.17 qualifying APM | Not yet set | The one-year 2.50% increase expires |
Four-decimal values from the rule text, for fee-schedule modelling: CY2020 36.0896, CY2021 32.4085, CY2022 33.5983, CY2023 33.0607, CY2024 32.7442, CY2025 32.3465, CY2026 33.5675 (qualifying APM) and 33.4009 (nonqualifying); CY2027 proposed 33.1693 (qualifying APM) and 32.8409 (nonqualifying), with proposed anesthesia factors of 20.4165 and 20.2143.
The CY2027 row is a proposal and the last column is deliberately blank. What Congress leaves in effect is not knowable until it acts, and this table's whole purpose is to keep those two things apart.
Reading the pattern. The conversion factor CMS finalized fell in four of the five years from CY2021 to CY2025 (CY2022 was the single increase), and the in-effect figure fell every single year across that span, from $36.09 to $32.35 — a decline of $3.74, or 10.4%, in nominal dollars before accounting for any inflation. CY2026 is the first increase in the series. It is also the first year in which the increase is partly temporary: the 2.50% component applies to CY2026 only.
Sources: CMS final rule fact sheets for CY2020, CY2022, CY2023, CY2024, CY2025 and CY2026; four-decimal values from the Federal Register rule text via GPO. The CY2024 two-period split is stated on the CMS Physician Fee Schedule page.
Why CY2026 Has Two Conversion Factors
CY2026 is the first year the Medicare Access and CHIP Reauthorization Act's differential update schedule takes effect. From CY2026 onward, statute sets a higher annual update for qualifying alternative payment model participants than for everyone else.
The CY2026 increase is built from three separate components:
- +0.75% statutory update for qualifying APM participants, or +0.25% for everyone else. This is the permanent differential.
- +2.50% one-year increase enacted in the One Big Beautiful Bill Act, applying to CY2026 only.
- +0.49% budget-neutrality adjustment.
Combined, CMS states the result as $33.57 for qualifying APM participants (+3.77%) and $33.40 for everyone else (+3.26%).
A discrepancy inside the published rule. The CY2026 final rule's own preamble, in the Summary of Costs and Benefits, states the conversion factor increase as "$0.39 (1.2 percent)" and "$0.23 (0.7 percent)" — figures that contradict both the same rule's regulatory impact analysis (33.5675 and 33.4009) and the CMS fact sheet (+3.77% and +3.26%). The preamble numbers are consistent with omitting the statutory 2.50% one-year increase. Neither of the two CY2026 correction notices altered them. Use +3.77% / +3.26% and the $33.57 / $33.40 values, which are what the impact analysis and the fact sheet both support.
Anesthesia is a separate conversion factor. Anesthesia services are priced on their own multiplier, not the physician conversion factor: 20.5998 for qualifying APM participants and 20.4976 for everyone else in CY2026, up from 20.3178 in CY2025.
What the CY2027 Proposed Rule Would Change
CMS issued the CY2027 Physician Fee Schedule proposed rule on July 14, 2026, and published it in the Federal Register on July 16 as document 2026-14327, cited 91 FR 43842. The comment period closes September 14, 2026. Everything in this section is a proposal; the final rule is expected around November 2026.
The proposal lowers both conversion factors:
| Conversion factor | CY2026 in effect | CY2027 proposed | Change |
|---|---|---|---|
| Qualifying APM participant | $33.57 | $33.17 | -$0.40 (-1.19%) |
| Everyone else | $33.40 | $32.84 | -$0.56 (-1.68%) |
| Anesthesia, qualifying APM | 20.5998 | 20.4165 | -0.1833 |
| Anesthesia, everyone else | 20.4976 | 20.2143 | -0.2833 |
Why the factor falls when both statutory updates are positive
Three components move the CY2027 conversion factor, and only one of them is negative. The statutory MACRA updates are +0.75% for qualifying APM participants and +0.25% for everyone else. A budget-neutrality adjustment adds +0.53%. Against those, the one-year 2.50% increase that Public Law 119-21 provided for CY2026 alone expires. CMS states the arithmetic plainly in its fact sheet: "This effectively means that current law requires -2.50% reduction in Medicare payment under the PFS compared to CY 2026."
The pattern is the one this page has documented since CY2020: CMS finalizes a number, a temporary statutory patch lifts it, the patch expires, and the number falls back. Congress legislated an in-year change in four of the seven years in the table above.
What a practice should actually do before September 14
- Model the nonqualifying factor, not the qualifying one, unless the practice has confirmed qualifying APM status for the CY2027 payment year. The $32.84 figure applies to most practices.
- Do not rebuild fee schedules yet. The proposal is not the rate. Rebuild after the final rule.
- Read the per-code impact, not the headline percentage — the next section explains why the conversion factor understates what happens to most of a practice's actual code mix.
- Comment if a proposed RVU change hits a high-volume code. The comment period is the only point at which the RVU proposals below are still moveable.
What the CY2027 Proposal Does to Individual Codes
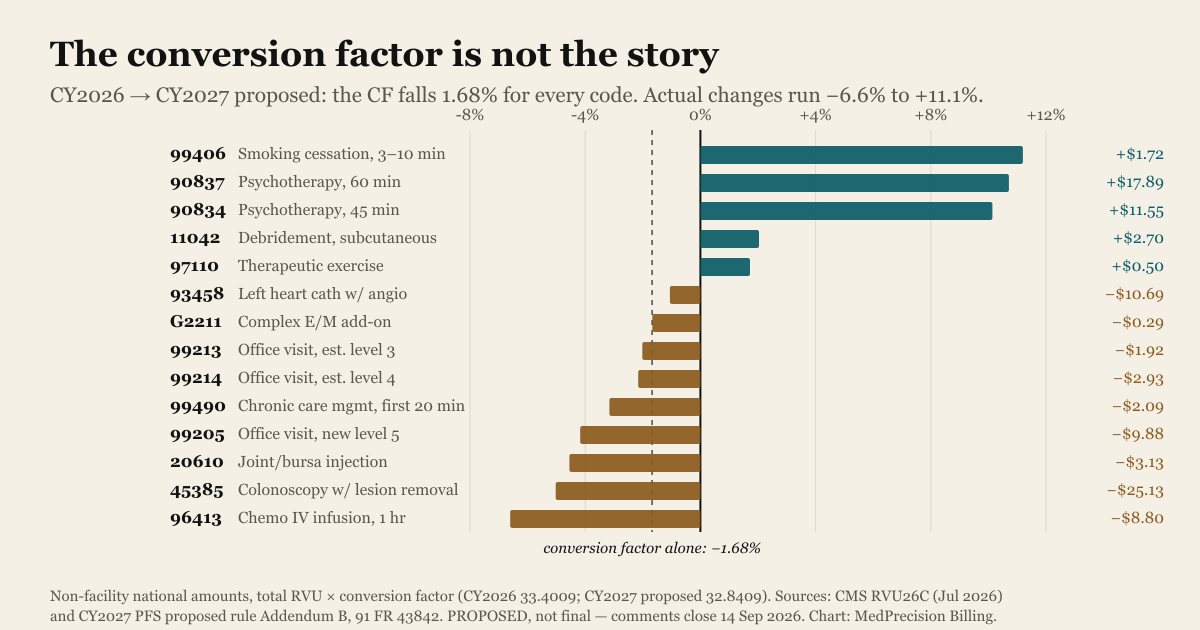
The conversion factor falls 1.68% for every code on the fee schedule. Almost no code actually changes by 1.68%, because CMS also proposes new relative value units, and the RVU changes are far larger than the conversion-factor change. Across the fourteen high-volume codes below, the proposed change ranges from -6.6% to +11.1% — a spread of nearly eighteen points around a conversion-factor movement of under two.
The figures are arithmetic, not modelling: total RVU multiplied by the conversion factor, national amounts with all geographic indices at 1.000, non-facility setting. CY2026 values come from the CMS RVU26C file (July 2026 update); CY2027 values from Addendum B of the proposed rule.
| Code | Service | CY2026 | CY2027 proposed | Change |
|---|---|---|---|---|
| 99406 | Smoking cessation, 3-10 min | $15.36 | $17.08 | +$1.72 (+11.1%) |
| 90837 | Psychotherapy, 60 min | $167.00 | $184.89 | +$17.89 (+10.7%) |
| 90834 | Psychotherapy, 45 min | $113.90 | $125.45 | +$11.55 (+10.1%) |
| 11042 | Debridement, subcutaneous | $132.60 | $135.30 | +$2.70 (+2.0%) |
| 97110 | Therapeutic exercise | $29.06 | $29.56 | +$0.50 (+1.7%) |
| 93458 | Left heart cath with angiography | $1,010.04 | $999.35 | -$10.69 (-1.1%) |
| G2211 | Complex E/M add-on | $17.37 | $17.08 | -$0.29 (-1.7%) |
| 99213 | Office visit, established, level 3 | $95.19 | $93.27 | -$1.92 (-2.0%) |
| 99214 | Office visit, established, level 4 | $135.61 | $132.68 | -$2.93 (-2.2%) |
| 99490 | Chronic care management, first 20 min | $66.13 | $64.04 | -$2.09 (-3.2%) |
| 99205 | Office visit, new, level 5 | $236.81 | $226.93 | -$9.88 (-4.2%) |
| 20610 | Joint or bursa injection | $68.81 | $65.68 | -$3.13 (-4.5%) |
| 45385 | Colonoscopy with lesion removal | $500.01 | $474.88 | -$25.13 (-5.0%) |
| 96413 | Chemotherapy IV infusion, 1 hr | $133.27 | $124.47 | -$8.80 (-6.6%) |
Which practices gain and which lose
Behavioral health is the clear winner in this proposal. The two psychotherapy codes that carry most outpatient mental health volume, 90834 and 90837, rise about 10% each — roughly $12 and $18 per session — while the office-visit family falls 2% to 4%. A practice billing 200 sessions of 90837 a month would see approximately $3,578 more per month at the proposed rates.
Proceduralists absorb the reductions. Colonoscopy with lesion removal loses $25.13 per procedure, chemotherapy infusion loses $8.80 per administration, and a new level-5 office visit loses $9.88. For a gastroenterology practice, the colonoscopy line alone can outweigh the entire conversion-factor change several times over.
Two codes deliberately left out of the table
29881 (knee arthroscopy with meniscectomy) appears in the CY2027 file with no non-facility rate at all, where CY2026 carried one. Its facility RVUs move only slightly, from 15.44 to 15.03. The change is real in the file but the rule text does not explain it, so this page does not report a payment change for it.
97153 and 97155 (adaptive behavior treatment) carry status indicator C in both years, meaning they are contractor-priced. No national Medicare amount exists for them, so no national comparison is possible — a point worth knowing for any ABA practice modelling Medicare revenue.
The Two CY2026 Changes That Move More Money Than the Conversion Factor
For most specialties, two policy changes in the CY2026 rule redistribute more revenue than the 3.26-3.77% conversion factor increase adds back.
The efficiency adjustment: -2.5% to work RVUs. CMS finalized a negative 2.5% adjustment to the work RVU and the intraservice portion of physician time for non-time-based services. Exempt from it: evaluation and management services, care management, behavioral health, services on the telehealth list, and maternity codes with global periods. CMS intends to apply the adjustment every three years using a five-year look-back at Medicare Economic Index productivity. Notably, CMS states its more recent Bureau of Labor Statistics total-factor-productivity data would have supported a 3.6% adjustment; it chose the more conservative 2.5%.
The site-of-service differential. When work RVUs are used to allocate indirect practice expense to facility RVUs, CMS now assigns them at one-half the amount allocated to non-facility practice expense RVUs for the same service. The aggregate effect across all specialties is a +4% practice-expense impact in non-facility settings and -7% in facility settings, netting to 0% overall.
The practical consequence: where a service is performed now changes its payment more than it used to. A practice that performs a procedure in its own office is favoured relative to the same procedure performed in a hospital outpatient department. Groups with mixed site-of-service patterns should model both settings before assuming the CY2026 increase is a net gain.
CY2026 Estimated Payment Impact by Specialty
The figures below are CMS's own estimates from the CY2026 final rule impact table (Table 92, printed as Table D-B7 in the display copy). These are RVU redistribution effects only — they exclude the conversion factor change. A specialty showing 0% is not flat overall; it is flat on redistribution and still receives the conversion factor increase.
| Specialty | Non-facility combined impact | Facility combined impact | Total combined impact | Allowed charges (millions) |
|---|---|---|---|---|
| Family practice | +6% | -9% | +3% | $5,461 |
| Pediatrics | +7% | -7% | +2% | $54 |
| Cardiology | +5% | -7% | +1% | $6,020 |
| Psychiatry | +6% | -9% | 0% | $835 |
| Internal medicine | +6% | -8% | -1% | $9,446 |
| Anesthesiology | +7% | -3% | -1% | $1,602 |
| Physical / occupational therapy | -1% | -7% | -1% | $6,205 |
| Radiology | +1% | -3% | -2% | $4,515 |
| Orthopedic surgery | +5% | -9% | -3% | $3,283 |
| Gastroenterology | +6% | -10% | -4% | $1,397 |
| All specialties | +4% | -7% | 0% | — |
Additional confirmed rows from the same table: vascular surgery +5%, rheumatology +4%, clinical social worker +4%, clinical psychologist +3%, endocrinology +3%, podiatry +2%, nurse practitioner +1%, physician assistant +1%, urology 0%, emergency medicine -1%, dermatology -2%, ophthalmology -2%, general surgery -3%, critical care -4%, plastic surgery -4%, neurosurgery -5%, infectious disease -6%.
For contrast, CY2025 was nearly flat on redistribution for almost every specialty: cardiology 0%, orthopedic surgery -1%, physical/occupational therapy 0%, pediatrics 0%, gastroenterology 0%, psychiatry +1%, family practice 0%, internal medicine 0%, radiology 0%, anesthesiology +2%. The only notable CY2025 movers were behavioral health non-physician specialties — clinical psychologist +3% and clinical social worker +4%.
The pattern across both years is consistent: the specialties gaining are those delivering care in non-facility settings, and the specialties losing are those whose volume sits in hospital outpatient departments and ambulatory surgery centres.
Source: CMS CY2026 PFS final rule, Table 92, via the Federal Register public inspection display copy.
What the Conversion Factor Does Not Tell You
A conversion factor increase is not the same as a revenue increase, because it is measured against a cost base that moves independently.
The Medicare Economic Index tracks the cost of running a physician practice. According to the Medicare Payment Advisory Commission's March 2026 Report to the Congress, MEI growth slowed to 3.0 percent in 2024 and is projected to moderate further in the coming years — to 2.7 percent in 2025, 2.2 percent in 2026, and 2.1 percent in 2027.
The longer comparison is the one that matters for planning. MedPAC reports that from 2000 to 2024, the MEI increased cumulatively by 56 percent compared with 14 percent for fee schedule updates. MedPAC qualifies this in the surrounding text, and the qualification should travel with the figure: the commission also notes that measures of payment adequacy — beneficiary access, supply of clinicians, and volume of services — have generally remained stable.
MedPAC also confirms the temporary nature of the CY2026 relief: the 2026 increase is "a one-year increase of 2.5 percent that applies in 2026 only," with the 0.75 percent and 0.25 percent differential updates resuming in 2027.
The planning implication is straightforward. A practice modelling CY2027 on a CY2026 revenue base is modelling on a number that statute already removes. The 2.50% component should be treated as non-recurring.
Source: MedPAC March 2026 Report to the Congress, Chapter 4, read 17 September 2026.
How to Calculate a Medicare Payment From the Conversion Factor
The calculation is mechanical once the RVU components are known. All RVU values come from the CMS Physician Fee Schedule Relative Value File; GPCI values come from the same release and vary by locality.
- Look up the three RVU components for the CPT or HCPCS code: work, practice expense, and malpractice. Practice expense has two values — facility and non-facility. Pick the one matching where the service was performed.
- Apply the geographic practice cost indices for the locality: multiply each RVU by its corresponding GPCI.
- Add the three adjusted components to get the total adjusted RVU.
- Multiply by the conversion factor — $33.57 or $33.40 for CY2026, depending on qualifying APM status.
- Apply any modifier or policy adjustments — multiple procedure reduction, assistant-at-surgery percentage, bilateral adjustment, or the site-of-service differential.
The result is the Medicare allowed amount. Medicare pays 80% of it after the deductible is met; the remaining 20% is patient coinsurance or secondary payer responsibility.
The most common error in practice modelling is applying the conversion factor to unadjusted national RVUs and treating the result as expected payment. Geographic adjustment alone moves the figure by double-digit percentages between localities, and the facility versus non-facility practice expense choice moves it further — which is exactly the variable CY2026 made more consequential.
What This Means for Practice Revenue Operations
A conversion factor change is a fee-schedule event, and fee-schedule events fail quietly. The revenue loss from a mispriced fee schedule does not appear as a denial; it appears as claims that pay correctly against the wrong expected amount, so nobody notices until a year-end reconciliation.
Three operational checks belong in every January:
- Reload the fee schedule and verify the loaded conversion factor. Confirm which of the two CY2026 conversion factors applies to each rendering provider based on qualifying APM status. A practice with mixed participation status has two expected-payment schedules, not one.
- Re-baseline expected reimbursement before measuring collection performance. Net collection rate is measured against the contractually allowed amount. If the allowed amounts in the practice management system are stale, the net collection rate is computed against a wrong denominator and will read high. This is the mechanism by which a fee-schedule error hides a real collection problem — see net collection rate and the collection rate calculator.
- Re-check the specialties with the largest redistribution. Gastroenterology at -4% and orthopedic surgery at -3% on RVU redistribution need their commercial contracts reviewed as well, since many commercial rates are expressed as a percentage of Medicare and inherit the change automatically.
Practices that outsource these checks should confirm their billing partner performs them on a stated schedule rather than on request. Our own cadence for fee-schedule reloads, payment-variance detection and monthly reporting is documented in the operating framework on our about page, and the underpayment-detection step specifically sits in payment posting. Where a practice wants the whole cycle owned end to end, that is revenue cycle management; where the concern is that past underpayments already went uncaught, a billing audit is the diagnostic.
Free Billing Audit · No obligation
Is Your Fee Schedule Actually Loaded Correctly?
A stale fee schedule does not produce denials, so it hides. Get a free billing audit and we will check your loaded expected reimbursement against the current Medicare rates, flag payment variances, and quantify what has gone uncaught.
Prefer to talk? Book a 15-minute callRequest received
A billing specialist will review your practice details and reach out within 1 business day. No confirmation email is sent — if you need to reach us sooner, call +1-872-297-2815.
Common Questions
Common questions about medicare physician fee schedule conversion factor: history, 2026 rates, and impact by specialty.
Get a Free Billing Audit
Our billing specialists can walk you through this and more.
Get a Free Billing AuditWhat is the proposed Medicare conversion factor for 2027?
CMS proposes $33.17 for qualifying alternative payment model participants and $32.84 for everyone else, down $0.40 (-1.19%) and $0.56 (-1.68%) from the CY2026 values of $33.57 and $33.40. The four-decimal values in the rule text are 33.1693 and 32.8409. These are proposed figures from a rule published July 16, 2026; the comment period closes September 14, 2026.
Why does the 2027 conversion factor fall if the statutory updates are positive?
The statutory MACRA updates are positive (+0.75% and +0.25%) and budget neutrality adds +0.53%, but the one-year 2.50% increase that Public Law 119-21 provided for CY2026 only does not carry into CY2027. CMS puts it directly: current law requires a -2.50% reduction compared to CY2026. The expiring patch outweighs the positive updates.
Will the 2027 conversion factor actually be $32.84?
Probably not. Congress changed the conversion factor actually in effect in four of the last six years, usually through end-of-year appropriations legislation, and the final rule itself can move the number before that. Treat $32.84 as the current legal baseline rather than a forecast, and rebuild fee schedules only after the final rule.
How much will the 2027 proposal change what my practice is paid?
It depends far more on the code mix than on the conversion factor. The conversion factor falls 1.68% for everyone, but proposed RVU changes push individual codes from about -6.6% to +11.1%. Psychotherapy codes 90834 and 90837 rise around 10%; colonoscopy with lesion removal falls 5.0% and chemotherapy infusion falls 6.6%. Model the practice's actual top twenty codes, not the headline.
What is the Medicare conversion factor for 2026?
There are two. Clinicians who are qualifying alternative payment model participants are paid on a conversion factor of $33.57 (33.5675 at four decimals), an increase of $1.22 or 3.77% over CY2025. All other clinicians are paid on $33.40 (33.4009), an increase of $1.05 or 3.26%. Anesthesia services use separate conversion factors of 20.5998 and 20.4976 respectively.
Why are there two Medicare conversion factors in 2026?
CY2026 is the first year of the differential update schedule set by the Medicare Access and CHIP Reauthorization Act. Statute provides a 0.75% annual update for qualifying alternative payment model participants and 0.25% for everyone else. Both groups also received a one-year 2.50% statutory increase for CY2026 only, plus a 0.49% budget-neutrality adjustment.
What was the Medicare conversion factor in 2025?
$32.35, or 32.3465 at four decimals. That was a decrease of $0.94, or 2.83%, from the $33.29 conversion factor in effect for most of CY2024. There was no in-year legislative change for CY2025, so the rule value and the in-effect value are the same.
Has the Medicare conversion factor gone up or down over time?
Down, until CY2026. The conversion factor actually in effect fell every year from CY2020 through CY2025, from $36.09 to $32.35 — a nominal decline of 10.4%. CY2026 is the first increase in the series, and part of it is temporary: the 2.50% component applies to CY2026 only and is removed in 2027.
What is the CY2026 efficiency adjustment?
A negative 2.5% adjustment applied to work RVUs and the intraservice portion of physician time for non-time-based services. Evaluation and management, care management, behavioral health, telehealth-list services, and global-period maternity codes are exempt. CMS plans to reapply it every three years using a five-year look-back at Medicare Economic Index productivity.
Which specialties are most affected by the CY2026 fee schedule?
On RVU redistribution alone, excluding the conversion factor increase, CMS estimates gastroenterology at -4%, orthopedic surgery at -3%, and radiology at -2%, while family practice gains +3% and pediatrics +2%. The dividing line is site of service: the CY2026 practice-expense change is +4% in non-facility settings and -7% in facility settings across all specialties.
Does the conversion factor affect commercial insurance payments?
Often, indirectly. Many commercial contracts express rates as a percentage of the Medicare fee schedule, so a conversion factor change flows through automatically to those contracts. Practices should confirm whether each commercial agreement references a specific fee schedule year or the current year, because the two produce materially different results after a year like CY2026.
Related Reading on This Topic
Related Services
Related Specialties
Is Your Fee Schedule Actually Loaded Correctly?
A stale fee schedule does not produce denials, so it hides. Get a free billing audit and we will check your loaded expected reimbursement against the current Medicare rates, flag payment variances, and quantify what has gone uncaught.
- No contract
- No setup fees
- Reply within 1 business day