Insurance Appeal Overturn Rate by Insurer: Marketplace Member Appeals, PY2024
By MedPrecision Operations Team · Published
This page ranks the insurance appeal overturn rate by insurer for ACA Marketplace plans, using the per-issuer appeal fields CMS publishes in its Transparency in Coverage public use file. The appeals counted are internal appeals filed by the insured, the plan member, and overturned in whole or in part. They are not provider appeals. The data cover plan year 2024 in states that use HealthCare.gov, and every qualifying record is in the CSV download.
What is the Marketplace appeal overturn rate by insurer?
In plan year 2024, the median HealthCare.gov-state Marketplace issuer overturned 35.61% of internal appeals filed by the insured (member appeals), a MedPrecision calculation across 106 issuer-state records with 100+ appeals in CMS's Transparency in Coverage file. Rates ranged from 0% at four issuer-state records to 85.71% at Blue Care Network of Michigan.
- Pooled across qualifying records: 33.86% of 251,548 member internal appeals overturned (MedPrecision calculation, not a national figure).
- 26 issuer-state records overturned 50% or more of member appeals; 10 overturned less than 20% (MedPrecision count).
- Oscar Health records hold 41.01% of qualifying member appeals, at a pooled overturn rate of 27.84% (MedPrecision calculation; parent per KFF grouping).
- The PY2026 CMS file holds PY2024 data: CMS data lag two plan years.
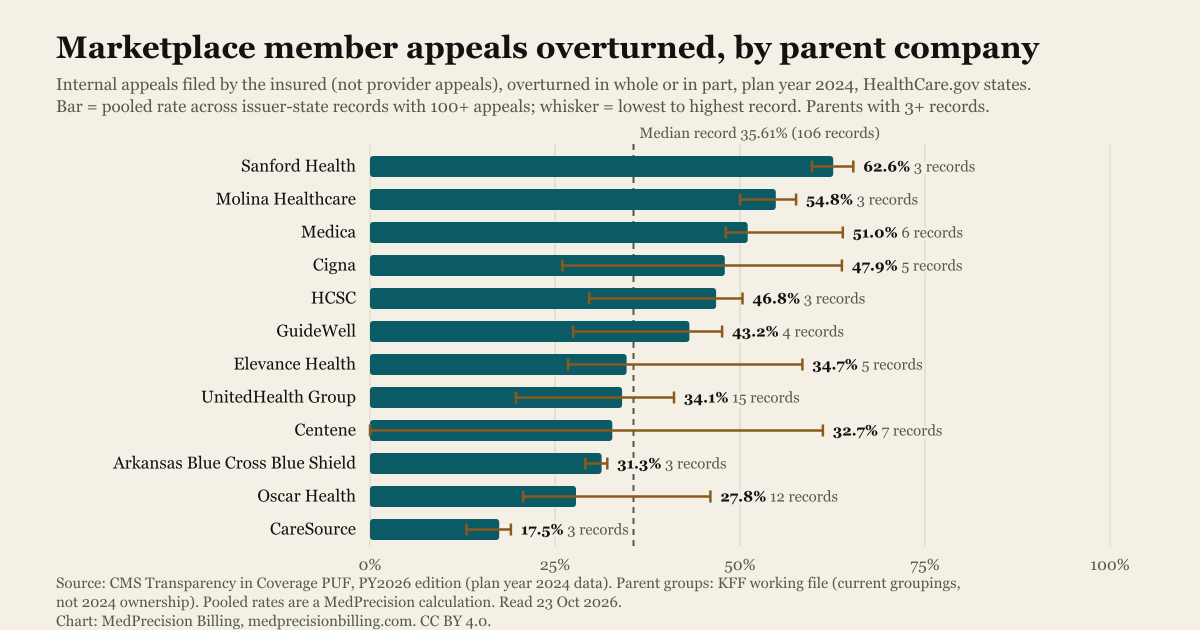
Insurance Appeal Overturn Rate by Insurer in HealthCare.gov States, PY2024
In plan year 2024, the median Marketplace issuer-state record in HealthCare.gov states overturned 35.61% of the internal appeals its members filed. That median covers 106 records in the CMS Transparency in Coverage public use file (TC-PUF), each with at least 100 member appeals and a CMS-published percent. The median is a MedPrecision calculation on CMS data, read on 23 October 2026.
Member appeal overturn rates spread widely across issuers. Four records report that the issuer overturned none of its member appeals, while Blue Care Network of Michigan overturned 85.71%, or 180 of 210. Issuers in the same state can sit far apart: in Texas, Cigna HealthCare of Texas overturned 63.77% of member appeals and Oscar Insurance Company overturned 23.64%.
- Median record: 35.61% of member internal appeals overturned (MedPrecision calculation, 106 records in 30 states).
- Middle half of records: 29.50% to 49.52% (25th to 75th percentile, MedPrecision calculation).
- Pooled across the qualifying records: 33.86%, or 85,177 overturned of 251,548 member internal appeals filed. This is a subset total, not a national figure.
- High and low tails: 26 records overturned 50% or more; 10 records overturned less than 20%, including the four 0% records.
In PY2024, Oscar Insurance Company in Texas received 38,325 internal appeals filed by its members, the most of any qualifying Marketplace issuer-state record, and overturned 23.64% of them (CMS TC-PUF PY2026, read 23 October 2026).
Blue Cross Blue Shield of Texas overturned 50.34% of 22,641 member internal appeals in PY2024 (CMS TC-PUF PY2026, read 23 October 2026).
The figures are two plan years old by design. CMS states that the PY2026 file contains PY2024 data, and that the file always reflects the plan year two years prior. CMS lists the file as updated 26 September 2025.
Highest and Lowest Member Appeal Overturn Rates by Issuer
The tables below show the top and bottom of the 106-record ranking. Each row is one issuer in one state, because CMS publishes appeal counts at issuer level for each state. Every count and percent is the figure CMS publishes; MedPrecision did not recompute the percent. All 106 records appear in the state-by-state table further down this page and in the CSV download.
Highest member appeal overturn rates (PY2024)
| Issuer | State | Parent company (KFF group) | Member internal appeals filed by the insured (PY2024) | Overturned in whole or in part | % overturned (CMS) |
|---|---|---|---|---|---|
| Blue Care Network of Michigan | MI | BCBS OF MI GRP | 210 | 180 | 85.71% |
| Summa Insurance Company, Inc. | OH | SUMMA HLTH GRP | 319 | 245 | 76.80% |
| Providence Health Plan | OR | PROVIDENCE HLTH GRP | 301 | 217 | 72.09% |
| Sanford Health Plan | ND | SANFORD HLTH GRP | 147 | 96 | 65.31% |
| Security Health Plan of Wisconsin, Inc. | WI | SANFORD HLTH GRP | 258 | 168 | 65.12% |
| Medical Health Insuring Corp. of Ohio | OH | MEDICAL MUT OF OH GRP | 657 | 421 | 64.08% |
| Medica Insurance Company | OK | MEDICA GRP | 144 | 92 | 63.89% |
| Cigna HealthCare of Texas, Inc. | TX | CIGNA HLTH GRP | 1,184 | 755 | 63.77% |
| Health First Commercial Plans, Inc. | FL | HEALTH FIRST GRP | 403 | 255 | 63.28% |
| Celtic Insurance Company | TX | CENTENE CORP GRP | 3,010 | 1,842 | 61.20% |
Citable finding: Blue Care Network of Michigan overturned 85.71% of the 210 internal appeals its members filed in PY2024, the highest of 106 qualifying issuer-state records (CMS TC-PUF PY2026, read 23 October 2026).
Lowest member appeal overturn rates (PY2024)
| Issuer | State | Parent company (KFF group) | Member internal appeals filed by the insured (PY2024) | Overturned in whole or in part | % overturned (CMS) |
|---|---|---|---|---|---|
| Celtic Insurance Company | AR | CENTENE CORP GRP | 1,813 | 0 | 0.00% |
| Ambetter of Magnolia Inc. | MS | CENTENE CORP GRP | 1,147 | 0 | 0.00% |
| QualChoice Life & Health Insurance Company, Inc. | AR | CENTENE CORP GRP | 397 | 0 | 0.00% |
| QCA Health Plan, Inc. | AR | CENTENE CORP GRP | 346 | 0 | 0.00% |
| Regence BlueCross BlueShield of Utah | UT | CAMBIA HEALTH SOLUTIONS INC | 487 | 60 | 12.32% |
| CareSource North Carolina Co. | NC | CARESOURCE GRP | 728 | 95 | 13.05% |
| Regence BlueCross BlueShield of Oregon | OR | CAMBIA HEALTH SOLUTIONS INC | 616 | 88 | 14.29% |
| CareSource Indiana, Inc. | IN | CARESOURCE GRP | 5,621 | 935 | 16.63% |
| CareSource Ohio, Inc. | OH | CARESOURCE GRP | 5,001 | 952 | 19.04% |
| UnitedHealthcare of Oklahoma, Inc. | OK | UNITEDHEALTH GRP | 218 | 43 | 19.72% |
Large records the ranking cannot show
The lowest table is not the full low tail. CMS suppression removes 12 records that each had 100 or more member appeals, and KFF groups 10 of them under Centene. Four of the 12 have both counts printed by CMS but a suppressed percent. MedPrecision computes their rates from the CMS counts:
| Issuer | State | Parent company (KFF group) | Member internal appeals filed by the insured (PY2024) | Overturned in whole or in part (CMS) | % overturned (MedPrecision calculation; CMS percent suppressed) |
|---|---|---|---|---|---|
| Celtic Insurance Company | KS | CENTENE CORP GRP | 1,121 | 20 | 1.78% |
| Health Net of Arizona, Inc. | AZ | CENTENE CORP GRP | 502 | 14 | 2.79% |
| CareSource West Virginia Co. | WV | CARESOURCE GRP | 993 | 65 | 6.55% |
| PacificSource Health Plans | OR | PACIFICSOURCE HLTH PLAN GRP | 136 | 12 | 8.82% |
All four sit below 12.32%, the lowest non-zero rate in the table above. The other eight records, all grouped by KFF under Centene, have a suppressed overturned count: Celtic Insurance Company in Tennessee (2,600 member appeals), Absolute Total Care in South Carolina (1,299), Ambetter of North Carolina (1,238), Meridian Health Plan of Michigan (844), Celtic Insurance Company in Oklahoma (446), Sunshine State Health Plan in Florida (437), Celtic Insurance Company in Alabama (377) and Ambetter Health of Louisiana (289). KFF notes that CMS suppresses observations lower than 10, so each of those eight records overturned fewer than 10 member appeals.
Four records show 0 overturned, three in Arkansas and one in Mississippi, as the first four rows above. These are printed as the issuers reported them. CMS states that all issuer claims data in the file are self-reported, so a 0% record may reflect how the issuer reported its appeals. It is not a finding of misconduct.
Arkansas shows how far issuers in one state can diverge. In Arkansas, the three records KFF groups under Centene each report 0 overturned, while the three Arkansas Blue Cross Blue Shield records overturned between 29.11% and 32.07% of member appeals.
Member Appeal Overturn Rate by Parent Company
A parent company often owns several issuers that each report appeal data to CMS, state by state. MedPrecision pools those records: the pooled rate is total overturned divided by total filed across the parent's qualifying records. The parent mapping comes from the Parent_Company column in KFF's 2024 working file. Parent groups are KFF's groupings, not PY2024 ownership. The table includes only parents with three or more qualifying records.
Sanford Health is the clearest case. KFF groups Security Health Plan of Wisconsin under Sanford, but Security Health Plan was a Marshfield Clinic Health System plan in PY2024. Sanford Health and Marshfield Clinic Health System completed their merger on 2 January 2025, as WEAU reported that day (weau.com, 2 January 2025). Without the Wisconsin record, Sanford would drop out of this table, so read its row as a view of current ownership.
| Parent company | KFF group code | Qualifying issuer-state records | Member internal appeals filed by the insured (PY2024) | Overturned in whole or in part | Pooled % overturned (MedPrecision calculation) | Lowest to highest record (CMS %) |
|---|---|---|---|---|---|---|
| Sanford Health | SANFORD HLTH GRP | 3 | 770 | 482 | 62.60% | 59.73% to 65.31% |
| Molina Healthcare | MOLINA HEALTHCARE INC GRP | 3 | 1,634 | 896 | 54.83% | 50.00% to 57.58% |
| Medica | MEDICA GRP | 6 | 1,885 | 962 | 51.03% | 48.08% to 63.89% |
| Cigna | CIGNA HLTH GRP | 5 | 3,521 | 1,688 | 47.94% | 26.00% to 63.77% |
| HCSC | HCSC GRP | 3 | 27,381 | 12,806 | 46.77% | 29.63% to 50.34% |
| GuideWell | GUIDEWELL MUT HOLDING GRP | 4 | 7,422 | 3,203 | 43.16% | 27.44% to 47.58% |
| Elevance Health | ELEVANCE HLTH INC GRP | 5 | 3,025 | 1,049 | 34.68% | 26.75% to 58.43% |
| UnitedHealth Group | UNITEDHEALTH GRP | 15 | 29,578 | 10,076 | 34.07% | 19.72% to 41.08% |
| Centene (7 of 17 records with 100+ appeals; 10 suppressed) | CENTENE CORP GRP | 7 | 8,129 | 2,662 | 32.75% | 0.00% to 61.20% |
| Arkansas Blue Cross Blue Shield | ARKANSAS BCBS GRP | 3 | 9,533 | 2,983 | 31.29% | 29.11% to 32.07% |
| Oscar Health | OSCAR HEALTH INC GRP | 12 | 103,151 | 28,715 | 27.84% | 20.70% to 46.00% |
| CareSource | CARESOURCE GRP | 3 | 11,350 | 1,982 | 17.46% | 13.05% to 19.04% |
Citable finding: Oscar Health's 12 qualifying issuer-state records hold 41.01% of all qualifying member internal appeals (103,151 of 251,548), and Oscar overturned a pooled 27.84% of them in PY2024 (MedPrecision calculation on CMS TC-PUF).
CareSource's three qualifying Marketplace issuers overturned a pooled 17.46% of member internal appeals in PY2024, the lowest pooled rate in this table, which counts only records with a CMS-published percent (MedPrecision calculation on CMS TC-PUF). Counted over every record with 100 or more member appeals, CareSource pools to 16.58% across four records, including CareSource West Virginia, and Centene's 17 records pool to 15.60% to 16.02%, lower still.
A pooled rate leans toward a parent's largest records. Oscar's pooled 27.84% carries the weight of its Texas record, where members filed 38,325 appeals. A parent's own records can also disagree sharply. Centene's 7 qualifying records run from 0.00% to 61.20%, around a pooled 32.75%, and UnitedHealth Group's 15 records run from 19.72% to 41.08%. Read a parent's pooled rate together with its per-state rows.
Centene's row covers only 7 of its 17 records with 100 or more member appeals. The other 10, holding 9,153 member appeals, are suppressed. Across all 17 records, Centene's pooled rate is 15.60% to 16.02% (MedPrecision calculation; the range allows 0 to 9 overturned in each suppressed cell), well below the 32.75% in the table.
All 106 Issuer-State Records by State
Every qualifying record is listed below, grouped by state and sorted from highest to lowest overturn rate within each state. Use it to find the issuers your patients carry. Each row is one issuer in one state, and every count and percent is the figure CMS publishes for internal appeals filed by the insured. Parent groups are KFF's groupings, not PY2024 ownership.
| Issuer | State | Parent company (KFF group) | Member internal appeals filed by the insured (PY2024) | Overturned in whole or in part | % overturned (CMS) |
|---|---|---|---|---|---|
| Premera Blue Cross Blue Shield of Alaska | AK | PREMERA BLUE CROSS GRP | 187 | 89 | 47.59% |
| Blue Cross and Blue Shield of Alabama | AL | BCBS OF AL GRP | 5,200 | 2,608 | 50.15% |
| UnitedHealthcare Insurance Company | AL | UNITEDHEALTH GRP | 2,741 | 1,054 | 38.45% |
| USAble HMO, Inc. | AR | ARKANSAS BCBS GRP | 686 | 220 | 32.07% |
| USAble Mutual Insurance Company | AR | ARKANSAS BCBS GRP | 7,600 | 2,400 | 31.58% |
| HMO Partners, Inc. | AR | ARKANSAS BCBS GRP | 1,247 | 363 | 29.11% |
| Celtic Insurance Company | AR | CENTENE CORP GRP | 1,813 | 0 | 0.00% |
| QCA Health Plan, Inc. | AR | CENTENE CORP GRP | 346 | 0 | 0.00% |
| QualChoice Life & Health Insurance Company, Inc. | AR | CENTENE CORP GRP | 397 | 0 | 0.00% |
| UnitedHealthcare of Arizona, Inc. | AZ | UNITEDHEALTH GRP | 2,607 | 993 | 38.09% |
| Blue Cross and Blue Shield of Arizona, Inc. | AZ | BCBS OF AZ INC | 4,769 | 1,806 | 37.87% |
| Oscar Health Plan, Inc. | AZ | OSCAR HEALTH INC GRP | 4,434 | 918 | 20.70% |
| Highmark BCBSD Inc. | DE | HIGHMARK GRP | 222 | 68 | 30.63% |
| Health First Commercial Plans, Inc. | FL | HEALTH FIRST GRP | 403 | 255 | 63.28% |
| Blue Cross and Blue Shield of Florida | FL | GUIDEWELL MUT HOLDING GRP | 3,012 | 1,433 | 47.58% |
| Health Options, Inc. | FL | GUIDEWELL MUT HOLDING GRP | 3,129 | 1,402 | 44.81% |
| Capital Health Plan | FL | GUIDEWELL MUT HOLDING GRP | 257 | 87 | 33.85% |
| Cigna Health and Life Insurance Company | FL | CIGNA HLTH GRP | 1,210 | 389 | 32.15% |
| Florida Health Care Plan, Inc. | FL | GUIDEWELL MUT HOLDING GRP | 1,024 | 281 | 27.44% |
| UnitedHealthcare of Florida, Inc. | FL | UNITEDHEALTH GRP | 3,373 | 882 | 26.15% |
| Hawaii Medical Service Association | HI | HAWAII MEDICAL SERV ASSN | 104 | 52 | 50.00% |
| Medica Insurance Company | IA | MEDICA GRP | 195 | 98 | 50.26% |
| Wellmark Health Plan of Iowa, Inc. | IA | WELLMARK INC GRP | 674 | 221 | 32.79% |
| Oscar Insurance Company | IA | OSCAR HEALTH INC GRP | 7,284 | 2,167 | 29.75% |
| Anthem Ins Companies Inc(Anthem BCBS) | IN | ELEVANCE HLTH INC GRP | 1,174 | 359 | 30.58% |
| CareSource Indiana, Inc. | IN | CARESOURCE GRP | 5,621 | 935 | 16.63% |
| Blue Cross and Blue Shield of Kansas, Inc. | KS | BCBS OF KS GRP | 174 | 96 | 55.17% |
| Oscar Insurance Company | KS | OSCAR HEALTH INC GRP | 4,096 | 1,440 | 35.16% |
| UnitedHealthcare Insurance Company | KS | UNITEDHEALTH GRP | 915 | 288 | 31.48% |
| CHRISTUS Health Plan Louisiana | LA | CHRISTUS HLTH GRP | 1,566 | 641 | 40.93% |
| UnitedHealthcare Insurance Company | LA | UNITEDHEALTH GRP | 521 | 182 | 34.93% |
| HMO Louisiana, Inc. | LA | LOUISIANA HLTH SERV GRP | 1,813 | 602 | 33.20% |
| Louisiana Health Service & Indemnity Company | LA | LOUISIANA HLTH SERV GRP | 364 | 117 | 32.14% |
| Blue Care Network of Michigan | MI | BCBS OF MI GRP | 210 | 180 | 85.71% |
| Blue Cross Blue Shield of Michigan Mutual Insurance Company | MI | BCBS OF MI GRP | 203 | 95 | 46.80% |
| Oscar Insurance Company | MI | OSCAR HEALTH INC GRP | 596 | 183 | 30.70% |
| UnitedHealthcare Community Plan, Inc. | MI | UNITEDHEALTH GRP | 671 | 159 | 23.70% |
| Priority Health | MI | COREWELL HLTH GRP | 130 | 28 | 21.54% |
| Medica Insurance Company | MO | MEDICA GRP | 208 | 100 | 48.08% |
| Healthy Alliance Life Co(Anthem BCBS) | MO | ELEVANCE HLTH INC GRP | 270 | 98 | 36.30% |
| UnitedHealthcare Insurance Company | MO | UNITEDHEALTH GRP | 1,119 | 386 | 34.50% |
| Oscar Insurance Company | MO | OSCAR HEALTH INC GRP | 5,920 | 1,884 | 31.82% |
| Cigna Health and Life Insurance Company | MS | CIGNA HLTH GRP | 257 | 125 | 48.64% |
| UnitedHealthcare of Mississippi, Inc. | MS | UNITEDHEALTH GRP | 196 | 61 | 31.12% |
| Ambetter of Magnolia Inc. | MS | CENTENE CORP GRP | 1,147 | 0 | 0.00% |
| Blue Cross and Blue Shield of Montana | MT | HCSC GRP | 336 | 104 | 30.95% |
| Montana Health Cooperative | MT | MONTANA HLTH COOPERATIVE | 1,163 | 279 | 23.99% |
| UnitedHealthcare of North Carolina, Inc | NC | UNITEDHEALTH GRP | 1,407 | 526 | 37.38% |
| Oscar Health Plan of North Carolina, Inc | NC | OSCAR HEALTH INC GRP | 875 | 320 | 36.57% |
| Blue Cross and Blue Shield of NC | NC | BCBS OF NC GRP | 2,160 | 779 | 36.06% |
| Cigna HealthCare of North Carolina, Inc. | NC | CIGNA HLTH GRP | 150 | 39 | 26.00% |
| CareSource North Carolina Co. | NC | CARESOURCE GRP | 728 | 95 | 13.05% |
| Sanford Health Plan | ND | SANFORD HLTH GRP | 147 | 96 | 65.31% |
| Blue Cross Blue Shield of North Dakota | ND | BCBS OF ND | 177 | 79 | 44.63% |
| Medica Insurance Company | NE | MEDICA GRP | 720 | 355 | 49.31% |
| Oscar Insurance Company | NE | OSCAR HEALTH INC GRP | 950 | 437 | 46.00% |
| Blue Cross and Blue Shield of Nebraska | NE | BCBS OF NE GRP | 870 | 198 | 22.76% |
| Matthew Thornton Hlth Plan(Anthem BCBS) | NH | ELEVANCE HLTH INC GRP | 396 | 166 | 41.92% |
| Summa Insurance Company, Inc. | OH | SUMMA HLTH GRP | 319 | 245 | 76.80% |
| Medical Health Insuring Corp. of Ohio | OH | MEDICAL MUT OF OH GRP | 657 | 421 | 64.08% |
| Buckeye Community Health Plan | OH | CENTENE CORP GRP | 333 | 198 | 59.46% |
| Molina Healthcare of Ohio, Inc. | OH | MOLINA HEALTHCARE INC GRP | 216 | 108 | 50.00% |
| UnitedHealthcare of Ohio, Inc. | OH | UNITEDHEALTH GRP | 944 | 330 | 34.96% |
| Oscar Insurance Corporation of Ohio | OH | OSCAR HEALTH INC GRP | 8,186 | 2,789 | 34.07% |
| Community Insurance Company(Anthem BCBS) | OH | ELEVANCE HLTH INC GRP | 841 | 225 | 26.75% |
| Oscar Buckeye State Insurance Corp. | OH | OSCAR HEALTH INC GRP | 18,709 | 4,700 | 25.12% |
| CareSource Ohio, Inc. | OH | CARESOURCE GRP | 5,001 | 952 | 19.04% |
| Medica Insurance Company | OK | MEDICA GRP | 144 | 92 | 63.89% |
| CommunityCare HMO Inc. | OK | COMMUNITYCARE GRP | 204 | 103 | 50.49% |
| Blue Cross Blue Shield of Oklahoma | OK | HCSC GRP | 4,404 | 1,305 | 29.63% |
| Oscar Insurance Company | OK | OSCAR HEALTH INC GRP | 4,223 | 1,159 | 27.44% |
| UnitedHealthcare of Oklahoma, Inc. | OK | UNITEDHEALTH GRP | 218 | 43 | 19.72% |
| Providence Health Plan | OR | PROVIDENCE HLTH GRP | 301 | 217 | 72.09% |
| Moda Health Plan, Inc. | OR | OREGON DENTAL SERV GRP | 173 | 67 | 38.73% |
| Regence BlueCross BlueShield of Oregon | OR | CAMBIA HEALTH SOLUTIONS INC | 616 | 88 | 14.29% |
| MOLINA HEALTHCARE OF SOUTH CAROLINA, INC | SC | MOLINA HEALTHCARE INC GRP | 422 | 243 | 57.58% |
| Blue Cross and Blue Shield of South Carolina | SC | BCBS OF SC GRP | 2,902 | 1,215 | 41.87% |
| UnitedHealthcare of South Carolina, Inc. | SC | UNITEDHEALTH GRP | 403 | 125 | 31.02% |
| Sanford Health Plan | SD | SANFORD HLTH GRP | 365 | 218 | 59.73% |
| Avera Health Plans, Inc. | SD | AVERA HLTH PLANS INC | 154 | 69 | 44.81% |
| Wellmark of South Dakota | SD | WELLMARK INC GRP | 152 | 43 | 28.29% |
| Cigna Health and Life Insurance Company | TN | CIGNA HLTH GRP | 720 | 380 | 52.78% |
| BlueCross BlueShield of Tennessee | TN | BCBS OF TN GRP | 587 | 264 | 44.97% |
| Oscar Insurance Company | TN | OSCAR HEALTH INC GRP | 9,553 | 3,657 | 38.28% |
| UnitedHealthcare Insurance Company | TN | UNITEDHEALTH GRP | 1,483 | 470 | 31.69% |
| Cigna HealthCare of Texas, Inc. | TX | CIGNA HLTH GRP | 1,184 | 755 | 63.77% |
| Celtic Insurance Company | TX | CENTENE CORP GRP | 3,010 | 1,842 | 61.20% |
| Scott and White Health Plan | TX | SCOTT & WHITE GRP | 5,246 | 3,157 | 60.18% |
| Superior Health Plan | TX | CENTENE CORP GRP | 1,083 | 622 | 57.43% |
| Molina Healthcare of Texas, Inc. | TX | MOLINA HEALTHCARE INC GRP | 996 | 545 | 54.72% |
| Blue Cross Blue Shield of Texas | TX | HCSC GRP | 22,641 | 11,397 | 50.34% |
| UnitedHealthcare of Texas, Inc. | TX | UNITEDHEALTH GRP | 12,386 | 4,333 | 34.98% |
| CHRISTUS Health Plan | TX | CHRISTUS HLTH GRP | 4,256 | 1,337 | 31.41% |
| Community Health Choice, Inc. | TX | HARRIS HLTH GRP | 1,054 | 260 | 24.67% |
| Oscar Insurance Company | TX | OSCAR HEALTH INC GRP | 38,325 | 9,061 | 23.64% |
| University of Utah Health Insurance Plans | UT | UNIVERSITY OF UT GRP | 482 | 155 | 32.16% |
| SelectHealth, Inc. | UT | IHC INC GRP | 5,422 | 1,467 | 27.06% |
| Regence BlueCross BlueShield of Utah | UT | CAMBIA HEALTH SOLUTIONS INC | 487 | 60 | 12.32% |
| Security Health Plan of Wisconsin, Inc. | WI | SANFORD HLTH GRP | 258 | 168 | 65.12% |
| Compcare Health Serv Ins Co(Anthem BCBS) | WI | ELEVANCE HLTH INC GRP | 344 | 201 | 58.43% |
| Medica Community Health Plan | WI | MEDICA GRP | 227 | 124 | 54.63% |
| Dean Health Plan | WI | MEDICA GRP | 391 | 193 | 49.36% |
| Quartz Health Benefit Plans Corporation | WI | UNIVERSITY HLTH CARE & GUNDERSEN LUTHERAN GRP | 204 | 98 | 48.04% |
| UnitedHealthcare of Wisconsin, Inc. | WI | UNITEDHEALTH GRP | 594 | 244 | 41.08% |
| Highmark Blue Cross Blue Shield West Virginia | WV | HIGHMARK GRP | 130 | 41 | 31.54% |
| Blue Cross Blue Shield of Wyoming | WY | BCBS OF WY | 434 | 173 | 39.86% |
A state's rows cover only issuers with at least 100 member appeals and a CMS-published percent. A missing issuer is not a neutral gap. CMS suppression removes 12 records with 100 or more member appeals, 10 of them grouped by KFF under Centene, and the four whose rates can be computed sit at 1.78% to 8.82% (see the section on the highest and lowest rates).
What CMS Counts: Appeals Filed by the Insured, Overturned in Whole or in Part
Every figure on this page rests on the definitions in the CMS PY2026 data dictionary. Read them before you quote a number, because the wording sets who filed the appeal and what counts as overturned.
- Internal appeals filed: "Number of requests by the insured for internal reviews of grievances involving adverse determinations." These are member appeals. CMS counts requests by the insured, not provider claim disputes a practice files in its own name.
- Internal appeals overturned: "All overturned internal appeals must be included, including those overturned in whole or in part." A partial reversal counts as overturned.
- Percent overturned: "# internal appeals overturned/# of internal appeals filed" by plan or issuer, "in favor of the beneficiary".
- Level: "Issuer-level data at the State level, for all QHPs on Exchange." An issuer that sells in more than one state appears once per state.
- Suppression: the workbook marks small cells with "**" as "Suppressed data due to small cell sizes". KFF notes that CMS suppresses observations lower than 10.
The file covers qualified health plans in states that use the Federally-facilitated Exchange, including states that perform plan management, and State-based Exchanges on the Federal Platform. States that run their own full exchange do not appear in the file.
How This Compares With KFF's HealthCare.gov Figures and Other Overturn Statistics
KFF reports appeal figures for HealthCare.gov consumers from the same CMS file, summed across the 157 issuers in its analysis, and this page does not replace them. KFF published its brief on 24 March 2026. It reports that "Of the approximately 85 million in-network denied claims in 2024, HealthCare.gov consumers appealed at least 262,982 – an appeal rate of less than 1%." KFF also reports that "Insurers upheld 165,863 (66%) denials on appeal."
The pooled 33.86% on this page is a different measure. It covers only the 106 records with at least 100 member appeals and a CMS-published percent, while KFF counts the 157 issuers in its analysis (insurers with more than 1,000 claims submitted), with no appeal-count threshold. The difference is the threshold, not the states covered. For KFF's figures alongside practice-side denial benchmarks, see the medical billing denial benchmarks page. The denial rate calculator gives you your own first-pass number, which sits upstream of any appeal.
Other overturn statistics you will see quoted measure different populations:
- KFF HealthCare.gov figures (157 issuers): at least 262,982 internal appeals by HealthCare.gov consumers in 2024, reported as a share upheld.
- This page: member internal appeals per issuer per state, PY2024, limited to records with at least 100 appeals.
- New York study: Healthcare Dive reported on 15 April 2026 (healthcaredive.com) on a JAMA study of about 51,000 New York cases across multiple insurance programs. The share of denials overturned after patients or their physicians appealed rose from 38% in 2019 to almost 53% in 2025. The study mixes patient and physician appeals, and the article does not state the appeal level, so we do not compare it with this page.
- Medicare Advantage prior authorization: a different program and a different decision type. Those figures are not comparable with Marketplace member appeals.
KFF's brief embeds six charts, and all six cut denial rates or denial reasons. KFF's downloadable working file does carry a per-issuer Internal_Appeals_Overturn_Rate column, unrendered and with no minimum beyond CMS's own small-cell suppression. On the first page of Google US organic results (9 per query) for three searches on 23 October 2026, we found no page that ranks HealthCare.gov-state Marketplace issuers by member internal appeal overturn rate. Some state exchanges, such as Covered California, post each issuer's own appeal counts.
Using Member Appeal Data in Your Practice: What Patient Appeals Show About Payers
Member appeal overturn rates describe appeals requested by the insured, your patient. CMS defines the count as requests by the insured. The file does not tell you how an issuer handles the provider claim disputes your office files in its own name. The data dictionary does not say how issuers count an appeal filed for the member by an authorized representative. What it does show is that issuer behaviour on appeal varies widely, even inside one state.
Issuer-to-issuer variation is the practical lesson for your practice. In Texas, the member overturn rate ran from 63.77% at Cigna HealthCare of Texas to 23.64% at Oscar Insurance Company. In Arkansas, three records KFF groups under Centene reported 0 overturned, next to Arkansas Blue Cross Blue Shield records at 29.11% to 32.07%. A single industry average hides gaps of that size, so measure your own overturn rate payer by payer. Start with the state table above: check which issuers in your payer mix appear, and where each one sits in its state's range.
Marketplace plans are individual-market commercial coverage, so their claims sit inside your commercial insurance billing, and their appeal behaviour differs by issuer. A per-payer log measures that difference in your own appeals:
- Count the appeals your office files with each payer every month.
- Count the appeals each payer overturned in whole or in part, using the same rule CMS uses.
- Divide overturned by filed for each payer, and compare quarter to quarter.
- Group the upheld appeals by denial reason, so you can fix the cause before the claim goes out.
When you do appeal, a clear appeal letter template keeps each submission complete and consistent. To turn the log into payer-level reporting, see revenue cycle analytics and reporting.
If keeping the log is more than your staff can carry, our denial management services page explains how we work denials and appeals by payer.
Method: 185 CMS Records to 106, the 100-Appeal Threshold and Suppression
MedPrecision built this ranking from the CMS file on 23 October 2026. The steps below let you reproduce it.
- Source. We downloaded the PY2026 TC-PUF from CMS and read the "Transparency 2026 - Ind QHP" sheet. CMS lists the file as updated 26 September 2025. The sheet holds 185 issuer-per-state records for Individual Marketplace medical QHPs. On 23 October 2026, CMS listed no PY2027 TC-PUF.
- Fields. We used these CMS fields per record: internal appeals filed, internal appeals overturned, and the CMS-published percent overturned. We printed the CMS percent as published.
- Threshold. We applied three filters in this order: a numeric filed count, at least 100 member internal appeals filed, then a numeric overturned count and a CMS-published percent. 106 records in 30 states remained.
- Exclusions. We excluded 79 records. First, 37 had no numeric filed count (26 N/A for a new issuer, 11 suppressed). Of the 148 with a filed count, 30 had fewer than 100 appeals filed. Of the 118 with 100 or more, 8 had a suppressed overturned count and 4 had both counts printed by CMS but a suppressed percent. The ranking prints no CMS percent for those 12; the section on the highest and lowest rates lists them.
- Statistics. We computed the median, the 25th and 75th percentiles (Python statistics.quantiles, exclusive method) and the pooled rate (100 × total overturned / total filed).
- Parent companies. We joined each record to the Parent_Company column in KFF's 2024 working file and pooled parents with three or more qualifying records. Parent groups are KFF's groupings, not PY2024 ownership.
Limitations
- Two plan years old. CMS states that the file always reflects the plan year two years prior, so PY2024 is the newest data.
- Self-reported. CMS states: "All issuer and plan level claims data is self-reported by QHP issuers to CMS."
- Not a quality score. CMS cautions that "The number of appeals filed is not necessarily indicative of issuer strength or plan quality." That caveat covers the filed count. CMS publishes no such note on the overturn percentage, and MedPrecision does not treat the rate as a quality score either.
- Internal appeals only. Provider appeals are not in the CMS file. CMS also publishes external appeal counts per issuer in the same file; this page does not rank them.
- HealthCare.gov states only. States that run their own full exchange are not in the file.
- Small issuers drop out. The 100-appeal threshold removes 30 records with fewer than 100 member appeals, so the ranking describes larger issuer-state records.
- Suppression removes large low-rate records. CMS suppression also removes 12 records with 100 or more member appeals (10,282 appeals in all), and KFF groups 10 of them under Centene. The four with printed counts compute to 1.78% to 8.82% (MedPrecision calculation), and each of the other eight overturned fewer than 10. The ranking's low tail and Centene's parent row are therefore incomplete.
Free Billing Screening · No obligation
Measure Your Own Overturn Rate by Payer
Member appeal data shows how far payer behaviour varies. Talk with our team about measuring the appeals your practice files, by payer and by denial reason.
Prefer to talk? Book a 15-minute callA free screening reviews a permitted 12-month practice-management export and provides a short written memo within five business days after receipt. It includes no chart review, coding opinion or extrapolated recovery figure. Chart-based audits are separately scoped and quoted.
Request received
A billing specialist will review your practice details and reach out within 1 business day. A confirmation email may also arrive. If it does not, you can reach us at +1-872-297-2815.
Cite this data
Licensed under CC BY 4.0: free to reuse with attribution to MedPrecision Billing, including the charts and the underlying dataset. Figures were verified against their primary sources on .
Citation line
Source: Marketplace Appeal Overturn Rate by Insurer, MedPrecision Billing. https://www.medprecisionbilling.com/resources/marketplace-appeal-overturn-rate-by-insurer/ Embed the chart
<a href="https://www.medprecisionbilling.com/resources/marketplace-appeal-overturn-rate-by-insurer/"><img src="https://www.medprecisionbilling.com/images/og/resources/marketplace-appeal-overturn-rate-by-insurer.png" alt="Bar chart of the plan year 2024 share of internal appeals filed by Marketplace members, not providers, that insurers overturned in whole or in part, pooled by parent company across HealthCare.gov issuer-state records with 100 or more appeals. Among parent companies with three or more qualifying records, Sanford Health is highest at 62.60% and CareSource lowest at 17.46%; the median issuer-state record is 35.61%." width="1200" height="630" style="max-width:100%;height:auto"></a>
<p>Source: <a href="https://www.medprecisionbilling.com/resources/marketplace-appeal-overturn-rate-by-insurer/">Marketplace Appeal Overturn Rate by Insurer</a> — MedPrecision Billing</p> Download the dataset
CSV — every row with its own source URLCommon Questions
Common questions about insurance appeal overturn rate by insurer, member appeals.
Get a Free Billing Screening
Our billing specialists can walk you through this and more.
Request a Free ScreeningWhat is the average internal appeal overturn rate for Marketplace insurers?
In HealthCare.gov states in PY2024, the median issuer-state record overturned 35.61% of member internal appeals across 106 qualifying records. The pooled rate was 33.86% (MedPrecision calculations on CMS TC-PUF). Both cover only records with at least 100 appeals. KFF's HealthCare.gov figures, across the 157 issuers in its analysis, are framed the other way: insurers upheld 165,863 (66%) denials on appeal in 2024.
Are these provider appeals?
No. CMS defines internal appeals filed as the "Number of requests by the insured for internal reviews of grievances involving adverse determinations." They are member appeals, filed by the plan member. Provider claim disputes your office files in its own name are not what this file measures. CMS does not say how issuers count an appeal filed for the member by an authorized representative.
Why does an insurer show a 0% overturn rate?
Four qualifying records report 0 overturned, three in Arkansas and one in Mississippi. They are printed as the issuers reported them. CMS states that all issuer claims data in the file are self-reported, so a 0% record may reflect reporting practice. It is not a finding of misconduct.
Why is my state or my insurer missing?
The CMS file covers states that use the Federally-facilitated Exchange and State-based Exchanges on the Federal Platform. States that run their own full exchange are not in it. Within covered states, we excluded records with no filed count (CMS marks new issuers N/A), fewer than 100 member appeals, or a suppressed count or percent. Suppression removed 12 records with 100 or more member appeals, 10 of them grouped by KFF under Centene, so a missing large issuer may have a low rate: the four we can compute run from 1.78% to 8.82%.
Is a high appeal overturn rate good or bad?
The data cannot tell you. A high rate can mean member appeals at that issuer are worth filing, or that its initial denials were weak. CMS cautions only about the filed count: "The number of appeals filed is not necessarily indicative of issuer strength or plan quality." CMS publishes no such note on the overturn percentage, and MedPrecision does not treat the rate as a quality score.
When will newer data be published?
We do not predict a date. On 23 October 2026, the newest file was the PY2026 TC-PUF, which contains PY2024 data. CMS lists it as updated 26 September 2025. CMS states that the file always reflects the plan year two years prior.
Related Reading on This Topic
Related Services
Measure Your Own Overturn Rate by Payer
Member appeal data shows how far payer behaviour varies. Talk with our team about measuring the appeals your practice files, by payer and by denial reason.
A free screening reviews a permitted 12-month practice-management export and provides a short written memo within five business days after receipt. It includes no chart review, coding opinion or extrapolated recovery figure. Chart-based audits are separately scoped and quoted.
- No obligation to continue
- Practice details only
- Reply within 1 business day