Medical Billing Benchmarks 2026
By MedPrecision Billing Editorial Team · Data verified
There is no single medical billing denial rate. The figures the industry quotes interchangeably — 8%, 11.81%, 12%, 15%, 19% — measure different populations on different denominators, and comparing them directly is what makes most published benchmark pages useless. This report gives each figure with its population, its denominator and its primary source, so you can find the one that describes a practice like yours.
The short answer
For physician practices, the only free measured denial figure is 8% of claims denied on first submission (MGMA, 2023). The commonly-cited 11.8–12% rates are hospital and mixed-population figures, and 19% is a payer-side marketplace rate. Roughly 84% of denials are potentially avoidable and 44% are front-end, with registration and eligibility the single largest cause at 24% (Optum, hospital data, 2023).
The 2026 benchmarks, with their populations named
Each row below states what was measured, on whom, and by whom. The population column is not a footnote — it is the difference between a benchmark that applies to you and one that does not.
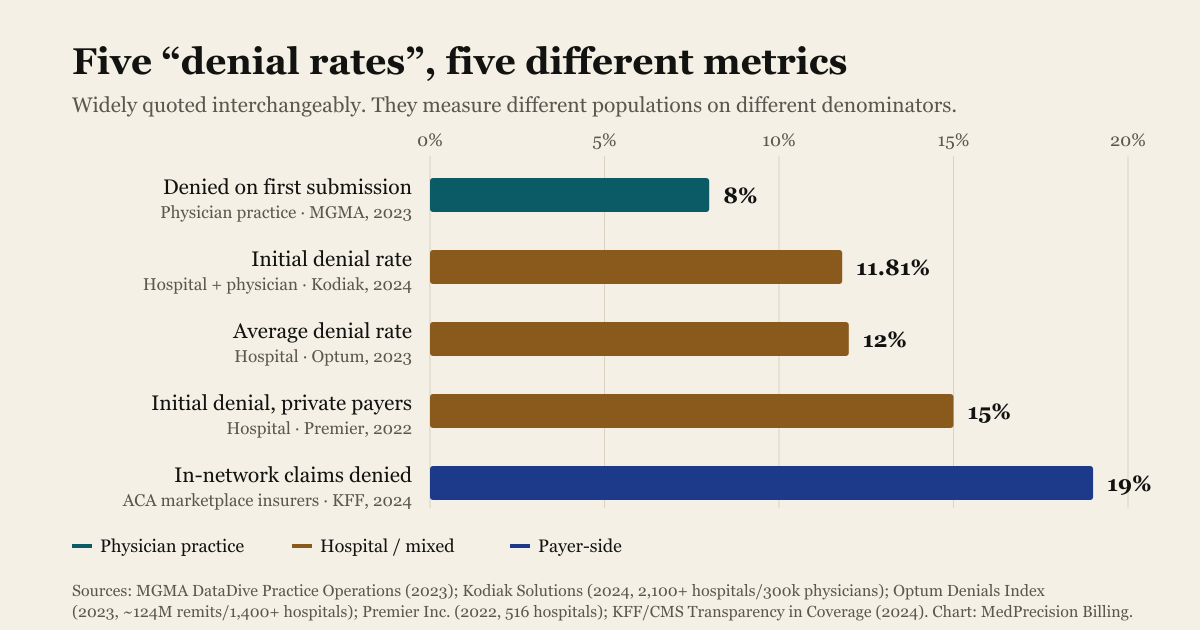
| Metric | Figure | Population | Source |
|---|---|---|---|
| Claims denied on first submission | 8% | Physician practice | MGMA, 2023 |
| Initial claim denial rate | 11.81% of claims | Mixed hospital + physician | Kodiak Solutions, 2024 |
| Average claim denial rate | 12% | Hospital / health system | Optum, 2023 |
| Initial denial rate on claims to private payers | Nearly 15% | Hospital / health system | Premier Inc., 2022 |
| In-network claim denial rate, ACA Marketplace issuers | 19% in-network; 37% out-of-network; insurer-level in-network range 3% to 36% | Payer-side (insurer-reported) | KFF, 2024 |
| Median final denial rate | 2.5% (2024) rising to 2.7% (2025) | Hospital / health system | Kodiak Solutions, 2025 |
Why published denial rates disagree with each other
Three separate things get called “the denial rate”, and mixing them produces the spread you see in most published comparisons.
- Different populations. Hospital claims and physician-practice claims deny at different rates, for different reasons. A hospital figure applied to a five-physician practice describes nothing about that practice.
- Different denominators. Optum counts claim remits. MGMA counts claims denied on first submission. AAFP’s target is dollar-based: denied claim dollars over submitted claim dollars. A dollar-based rate and a count-based rate are not comparable even within one organization.
- Different sides of the transaction. KFF’s 19% is what insurers denied, reported by insurers under federal transparency rules. It is not what a provider experienced filing claims.
The most-miscited figure in this field: Experian Health’s “41%” is the share of survey respondents reporting a denial rate of 10% or higher — 250 professionals surveyed in mid-2025. It is not a denial rate, and it is routinely reproduced as one.
Hospital data is not physician-practice data
The physician-practice number is the lower one. MGMA puts claims denied on first submission at 8%, and notes the same rate in 2019. Hospital initial denial rates run 11.81% to 12%. A page that tells a practice owner their peers deny at 12% is quoting hospital data at them.
This matters beyond accuracy. A practice benchmarking itself against a hospital figure will conclude it is performing well at 10% when its actual peer group sits at 8% — and will leave the difference uninvestigated.
What actually causes denials
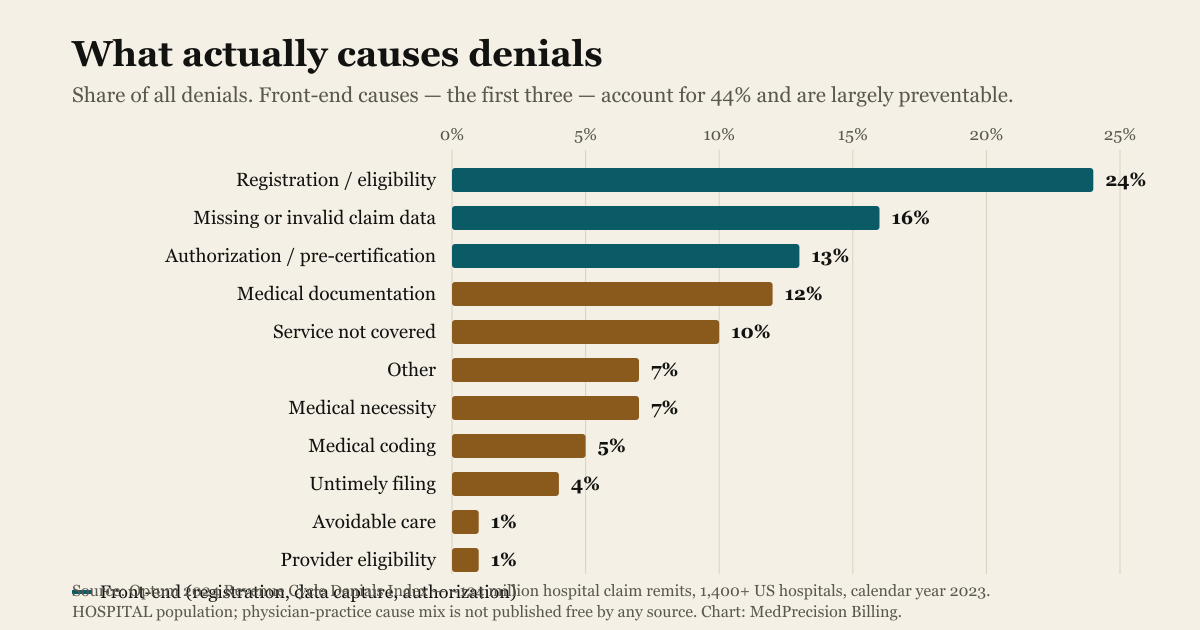
Registration and eligibility is the largest single cause at 24%, and has held that position for four consecutive years. Together with claim-data errors and authorization, front-end causes account for 44% of all denials — failures that happen before a coder touches the claim.
This is hospital data. No free source publishes an equivalent cause breakdown for physician practices; the closest is an MGMA Stat poll of 288 group leaders in January 2026, in which 48% named denials and appeals as their biggest revenue-cycle leak and 23% named front-end issues — a perception measure, not a claim measurement. Reducing front-end denials is what eligibility verification and prior authorization support exist to do.
A/R and collection benchmarks
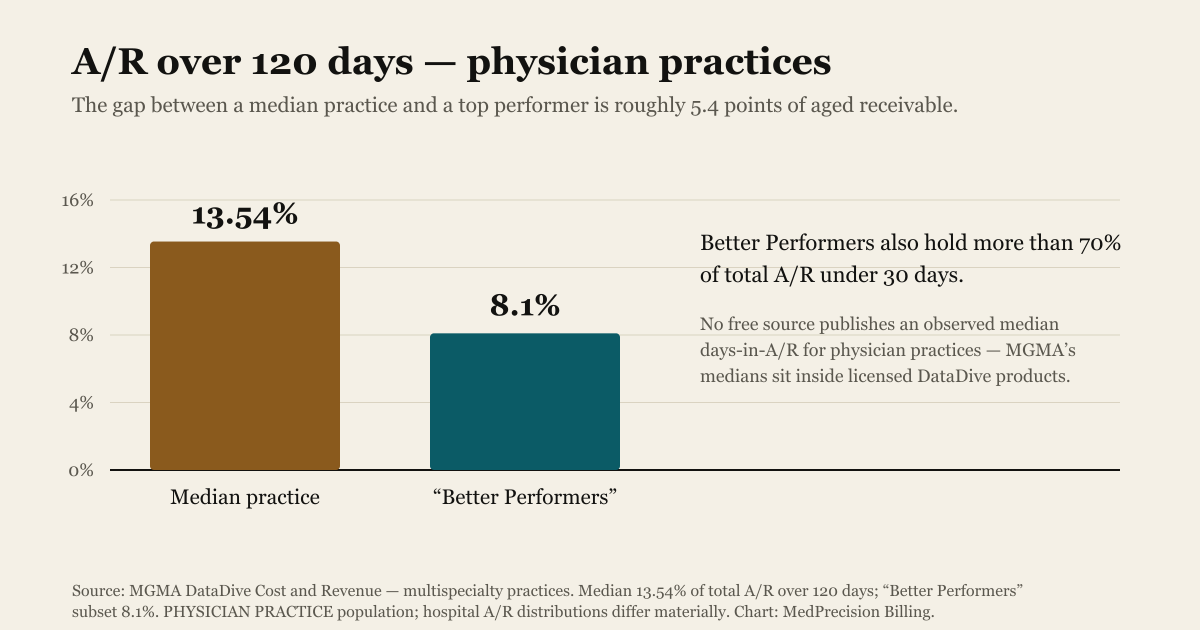
The targets below are guidance ranges published by AAFP, not measured medians. We cite AAFP directly because the versions of these numbers circulating as “HFMA benchmarks” are not HFMA research — see the methodology section.
| Metric | Published target | Type |
|---|---|---|
| Denial rate — published target range | A 5% to 10% denial rate is the industry average; keeping the denial rate below 5% is more desirable | Target (no sample) |
| Days in A/R — published target | Days in A/R should stay below 50 days at minimum; however, 30 to 40 days is preferable | Target (no sample) |
| Adjusted collection rate — published target | The adjusted collection rate should be 95%, at minimum; the average collection rate is 95% to 99% | Target (no sample) |
Measure your own against these with the collection rate calculator and the denial rate calculator.
What no free source publishes
Stating the gaps is part of the report. Each of these is routinely published elsewhere as a confident number; none of them could be traced to a free primary source.
- Observed median days in A/R for physician practices. MGMA collects it; the medians sit inside licensed DataDive products. AAFP publishes a target (below 50 days at minimum, 30–40 preferable), not a measurement.
- Observed net collection rate median. Does not exist free. AAFP publishes an adjusted collection rate target of 95% minimum, 95–99% average.
- Clean claim rate target. The ubiquitous 98% traces to vendor-sponsored content citing a trade publication. No methodology at any link in the chain.
- Denial rates by specialty. Every source offering them is a billing-company blog citing nothing. We publish none.
- Denial-code frequency rankings. No authoritative CARC-level frequency data exists — X12 publishes no usage statistics and neither does CMS. See the denial code database.
- Benchmarks by practice size. Not published free by anyone for denial or A/R metrics.
Methodology, sample sizes and limitations
What this report is. A compilation of publicly published figures, not original research. MedPrecision did not survey practices and does not publish client data. Every figure was fetched from its primary source on July 28, 2026 and then independently re-fetched by a second pass instructed to refute it; figures that could not be confirmed verbatim were dropped rather than softened.
What we corrected. The “98% clean claim rate”, “97–99% net collection rate” and “A/R over 90 days below 10%” figures widely attributed to HFMA trace to a single article on hfma.org carrying a “Sponsored by Conifer Health Solutions” disclosure. That article attributes its own figures to AAFP, and its clean-claim figure to Becker’s ASC Review. HFMA MAP Keys publishes metric definitions and equations, not target values. We cite AAFP directly and state the clean claim rate as unavailable.
Limitations. Several key sources are vendor research (Optum, Kodiak, Experian, Tebra) whose client bases are self-selected and not representative samples. Kodiak’s two releases disagree on the 2024 final denial rate (2.8% vs a 2.5% median) and publish no reconciling formula — both are reported here. Some figures are several years old because no newer free equivalent exists. MGMA’s richest data is licensed and could not be used.
| Source | Sample, as the source states it |
|---|---|
| Optum 2024 | ~124 million hospital claim remits valued at $500 billion in total charges, from more than 1,400 U.S. hospitals, submitted January–December 2023 |
| Kodiak Solutions 2025 | More than 2,100 hospitals and 300,000 practice-based physicians using the Kodiak Revenue Cycle Analytics platform, calendar year 2024 |
| Kodiak Solutions 2026 | More than 2,300 hospitals and 375,000 practice-based physicians on the Kodiak platform, across all 50 states |
| KFF 2026 | 157 reporting insurers; ~496 million claims received in 2024, 91% (451 million) for in-network services; from the CMS Transparency in Coverage 2026 Public Use File |
| KFF 2025 | 175 insurers; 471 million claims received in 2023, 93% (436 million) in-network |
| Premier Inc. 2025 | Survey of 280 hospitals across 23 states, over 48,000 acute care beds; claims studied 1 Jan – 31 Dec 2023; fielded 8 Aug 2024 – 4 Feb 2025 |
| Premier Inc. 2024 | Voluntary national survey of 516 Premier member hospitals across 36 states, 52,123 acute care beds; 2022 claims |
| MGMA 2023 | MGMA DataDive Practice Operations, single-specialty aggregate |
| MGMA 2021 | MGMA DataDive Cost and Revenue, multispecialty practices |
| MGMA 2021 | 2021 MGMA DataDive Cost and Revenue (2020 data), multispecialty groups with primary and specialty care, "Better Performers" subset |
| MGMA 2026 | MGMA Stat poll of medical group leaders, 6 January 2026; 288 applicable responses |
| Experian Health 2025 | Quantitative survey of 250 healthcare professionals responsible for financial, billing or claims-management decisions, fielded June–July 2025 |
| CAQH 2024 | More than 600 provider organizations across medical and dental, and health plans covering 63 percent of insured lives |
| CAQH 2023 | Provider labor cost per transaction calculated by NORC from surveyed provider staff time per transaction × loaded average salary |
| HHS Office of Inspector General 2022 | Stratified random sample of 250 prior authorization denials and 250 payment denials issued by 15 of the largest Medicare Advantage Organizations during 1–7 June 2019 |
| American Medical Association 2026 | AMA survey of 1,000 practising physicians |
| U.S. Bureau of Labor Statistics 2025 | OEWS survey, May 2025 reference period; national employment for the occupation 194,720. Read 17 September 2026. |
| U.S. Bureau of Labor Statistics 2026 | US private industry workers, all occupations and industries; reference period March 2026; cost per hour worked. Read 17 September 2026. |
| U.S. Bureau of Labor Statistics 2026 | NAICS 62 health care and social assistance; monthly rates, seasonally adjusted, May 2026 as revised. Read 17 September 2026. |
| AAPC 2026 | US respondents to AAPC’s annual salary survey; 2025 income data |
| SHRM 2025 | US organizations; n = 2,371 SHRM members responded overall (per-metric n not stated for cost-per-hire) |
| Tebra 2026 | Survey of medical billing companies fielded 1–17 December 2025; n = 190 respondents |
Cite this data
Free to reuse with attribution — including the charts and the underlying dataset. Figures were verified against their primary sources on .
Citation line
Source: MedPrecision Medical Billing Benchmarks Report 2026, MedPrecision Billing. https://www.medprecisionbilling.com/benchmarks/ Embed the chart
<a href="https://www.medprecisionbilling.com/benchmarks/"><img src="https://www.medprecisionbilling.com/images/benchmarks/denial-rate-by-population.png" alt="Five published medical billing denial rates compared by population" width="1200" height="630" style="max-width:100%;height:auto"></a>
<p>Source: <a href="https://www.medprecisionbilling.com/benchmarks/">MedPrecision Medical Billing Benchmarks Report 2026</a> — MedPrecision Billing</p> Download the dataset
CSV — every row with its own source URLCommon Questions
Common questions about medical billing benchmarks and how to read them.
Benchmark your own practice
We trace denials, aging A/R and under-coding to root cause and quantify the dollar impact.
Get a Free Billing AuditWhat is a good claim denial rate for a physician practice?
The only free, credible measured figure for physician practices is MGMA’s 8% of claims denied on first submission (2023 DataDive Practice Operations, single-specialty aggregate). AAFP publishes a guidance target of 5% to 10%, with below 5% preferable — but that is a practice-management target rather than a measurement, and it is computed on a different basis: AAFP defines it as denied claim dollars over submitted claim dollars, so it is not interchangeable with a rate measured on claim counts. AAFP attaches no population, sample size or data year to it (verified 17 September 2026). Be careful with the widely-quoted 11.8% to 12% figures: those are hospital and mixed-population rates, not physician-practice rates.
Why do medical billing benchmarks vary so much between sources?
Almost entirely because of population and denominator. Optum’s 12% counts hospital claim remits. Kodiak’s 11.81% counts a mixed base of hospitals and practice-based physicians. MGMA’s 8% counts physician-practice claims denied on first submission. KFF’s 19% is payer-side — claims denied by ACA marketplace insurers, not claims a provider filed. AAFP’s 5–10% is a target computed on dollars — denied claim dollars over submitted claim dollars — with no population, sample size or data year attached. None of these are wrong; they simply measure different things, and comparing them directly produces a meaningless spread.
What is the difference between an initial denial rate and a final denial rate?
An initial denial rate counts claims denied on first adjudication. A final denial rate counts what remains denied after appeals are exhausted — the money actually written off. The gap is large: Kodiak reported an 11.8% initial denial rate for 2024 against a final denial rate of 2.8% in its 2025 release. Note Kodiak’s own 2026 release restates that same year as a 2.5% median, and publishes no formula reconciling the two, so we report both rather than pick one.
Is the 98% clean claim rate target real?
We could not source it. The figure traces to a Conifer Health Solutions-sponsored article published on hfma.org, which itself attributes it to Becker’s ASC Review — third-hand, with no methodology at any step. HFMA MAP Keys publishes metric definitions, not target values, and AAFP publishes no clean claim rate figure. We report the blank rather than relay the number.
What percentage of denials can be prevented?
Optum reports that 84% of denials are potentially avoidable, though 22% of those are not recoverable once they occur, and that 44% of denials are front-end — arising in registration, eligibility and authorization before a claim is ever coded. Registration and eligibility alone account for 24% of all denials and have been the largest single cause for four consecutive years. These are hospital figures; no free source publishes an equivalent cause breakdown for physician practices.
Can I reuse this data?
Yes, with attribution. Every figure carries its original publisher and source URL, the charts are free to embed, and the full dataset is downloadable as CSV with a source URL on every row. We ask that you cite the original publisher alongside us where you reuse a specific figure.
How does your practice actually compare?
A free billing audit measures your denial rate, days in A/R and net collection rate against the sourced benchmarks above — with written findings in 3–5 business days.
- No contract
- No setup fees
- Reply within 1 business day